Exercise: Phylogeny - Answers (Seaview version): Difference between revisions
(→Step 9) |
(→Step 9) |
||
| Line 274: | Line 274: | ||
# 54 results. <br>Search string: <!-- <tt>name:"ribosomal protein l3" taxonomy:eukaryota fragment:no AND reviewed:yes</tt> --> <tt>(protein_name:"ribosomal protein l3") AND (taxonomy_id:2759) AND (fragment:false) AND (reviewed:true)</tt> | # 54 results. <br>Search string: <!-- <tt>name:"ribosomal protein l3" taxonomy:eukaryota fragment:no AND reviewed:yes</tt> --> <tt>(protein_name:"ribosomal protein l3") AND (taxonomy_id:2759) AND (fragment:false) AND (reviewed:true)</tt> | ||
# 8 and 27 results, respectively. <br>Search strings: <!-- <tt>name:"ribosomal protein l3" taxonomy:eukaryota fragment:no locations:(location:mitochondrion) AND reviewed:yes</tt> --> <tt>(protein_name:"ribosomal protein l3") AND (taxonomy_id:2759) AND (fragment:false) AND (reviewed:true) AND (cc_scl_term:SL-0173)</tt><br>and <!-- <tt>name:"ribosomal protein l3" taxonomy:eukaryota fragment:no locations:(location:cytoplasm) AND reviewed:yes</tt> --> <tt>(protein_name:"ribosomal protein l3") AND (taxonomy_id:2759) AND (fragment:false) AND (reviewed:true) AND (cc_scl_term:SL-0086)</tt> <br>Under the <u>Download</u> tab in UniProt, select "Download all", "FASTA (canonical)" and "Uncompressed". | # 8 and 27 results, respectively. <br>Search strings: <!-- <tt>name:"ribosomal protein l3" taxonomy:eukaryota fragment:no locations:(location:mitochondrion) AND reviewed:yes</tt> --> <tt>(protein_name:"ribosomal protein l3") AND (taxonomy_id:2759) AND (fragment:false) AND (reviewed:true) AND (cc_scl_term:SL-0173)</tt><br>and <!-- <tt>name:"ribosomal protein l3" taxonomy:eukaryota fragment:no locations:(location:cytoplasm) AND reviewed:yes</tt> --> <tt>(protein_name:"ribosomal protein l3") AND (taxonomy_id:2759) AND (fragment:false) AND (reviewed:true) AND (cc_scl_term:SL-0086)</tt> <br>Under the <u>Download</u> tab in UniProt, select "Download all", "FASTA (canonical)" and "Uncompressed". | ||
# Then use a plain text editor to combine them. Combined FASTA file is here: [https://teaching.healthtech.dtu.dk/material/22111/ | # Then use a plain text editor to combine them. Combined FASTA file is here: [https://teaching.healthtech.dtu.dk/material/22111/Ribosomal_proteins_35.fasta.txt Ribosomal_proteins_35.fasta.txt] | ||
==Step 10== | ==Step 10== | ||
Revision as of 15:31, 26 November 2024
Step 1
Here is a PDF with the aligned sequences.
Step 2
This is the text file with the pairwise distances. It is clear that the sequence HTLV shows larger distances than all the other sequences, with all distances being above 0.7.
#distances order: d(1,2),...,d(1,n) <new line> d(2,3),...,d(2,n) <new line>...
20
0.750305 0.751523 0.75 0.752741 0.752741 0.752741 0.750305 0.750305 0.752741 0.749086 0.741778 0.747868 0.749086 0.744214 0.750305 0.747868 0.747868 0.747868 0.74665
0.0158343 0.0414634 0.0304507 0.043849 0.0341048 0.0170524 0.0803898 0.045067 0.399513 0.399513 0.389769 0.393423 0.394641 0.389769 0.394641 0.130329 0.389769 0.389769
0.0402439 0.0292326 0.0414129 0.0328867 0.00974421 0.0803898 0.0426309 0.399513 0.401949 0.392205 0.393423 0.394641 0.389769 0.394641 0.129111 0.388551 0.388551
0.0365854 0.0512195 0.0365854 0.0439024 0.0865854 0.054878 0.4 0.40122 0.396341 0.392683 0.395122 0.392683 0.397561 0.130488 0.392683 0.392683
0.0341048 0.0304507 0.0316687 0.0791717 0.0389769 0.397077 0.399513 0.389769 0.390987 0.392205 0.389769 0.392205 0.127893 0.387333 0.387333
0.043849 0.043849 0.0767357 0.0219245 0.390987 0.394641 0.386114 0.386114 0.388551 0.387333 0.389769 0.125457 0.386114 0.386114
0.0365408 0.0767357 0.047503 0.394641 0.397077 0.388551 0.388551 0.389769 0.386114 0.390987 0.131547 0.388551 0.388551
0.0828258 0.045067 0.401949 0.404385 0.394641 0.394641 0.397077 0.390987 0.393423 0.130329 0.388551 0.388551
0.0767357 0.398295 0.403167 0.392205 0.395859 0.394641 0.394641 0.397077 0.137637 0.400731 0.399513
0.393423 0.397077 0.387333 0.388551 0.389769 0.389769 0.389769 0.125457 0.388551 0.388551
0.0816078 0.0694275 0.0645554 0.0511571 0.0682095 0.0657734 0.392205 0.125457 0.120585
0.0511571 0.0840438 0.088916 0.09257 0.0864799 0.397077 0.131547 0.129111
0.0779537 0.0730816 0.0791717 0.0767357 0.394641 0.127893 0.121803
0.0645554 0.0633374 0.0572473 0.392205 0.118149 0.112058
0.0682095 0.0621194 0.386114 0.120585 0.118149
0.0657734 0.389769 0.126675 0.123021
0.394641 0.116931 0.115713
0.388551 0.388551
0.0146163
HTLV HIV1B5 HIV1H2 HIV1MN HIV1N5 HIV1ND HIV1OY HIV1PV HIV1U4 HIV1Z2 HIV2CA HIV2D1 HIV2G1 HIV2KR HIV2RO HIV2SB HIV2ST SIVCZ Smanga_S4 Smanga_SP

#pairwise distances
HIV1B5,HTLV: 0.750305
HIV1H2,HTLV: 0.751523
HIV1MN,HTLV: 0.75
HIV1N5,HTLV: 0.752741
HIV1ND,HTLV: 0.752741
HIV1OY,HTLV: 0.752741
HIV1PV,HTLV: 0.750305
HIV1U4,HTLV: 0.750305
HIV1Z2,HTLV: 0.752741
HIV2CA,HTLV: 0.749086
HIV2D1,HTLV: 0.741778
HIV2G1,HTLV: 0.747868
HIV2KR,HTLV: 0.749086
HIV2RO,HTLV: 0.744214
HIV2SB,HTLV: 0.750305
HIV2ST,HTLV: 0.747868
HTLV,SIVCZ: 0.747868
HTLV,Smanga_S4: 0.747868
HTLV,Smanga_SP: 0.74665
HIV1B5,HIV1H2: 0.0158343
HIV1B5,HIV1MN: 0.0414634
HIV1B5,HIV1N5: 0.0304507
HIV1B5,HIV1ND: 0.043849
HIV1B5,HIV1OY: 0.0341048
HIV1B5,HIV1PV: 0.0170524
HIV1B5,HIV1U4: 0.0803898
HIV1B5,HIV1Z2: 0.045067
HIV1B5,HIV2CA: 0.399513
HIV1B5,HIV2D1: 0.399513
HIV1B5,HIV2G1: 0.389769
HIV1B5,HIV2KR: 0.393423
HIV1B5,HIV2RO: 0.394641
HIV1B5,HIV2SB: 0.389769
HIV1B5,HIV2ST: 0.394641
HIV1B5,SIVCZ: 0.130329
HIV1B5,Smanga_S4: 0.389769
HIV1B5,Smanga_SP: 0.389769
HIV1H2,HIV1MN: 0.0402439
HIV1H2,HIV1N5: 0.0292326
HIV1H2,HIV1ND: 0.0414129
HIV1H2,HIV1OY: 0.0328867
HIV1H2,HIV1PV: 0.00974421
HIV1H2,HIV1U4: 0.0803898
HIV1H2,HIV1Z2: 0.0426309
HIV1H2,HIV2CA: 0.399513
HIV1H2,HIV2D1: 0.401949
HIV1H2,HIV2G1: 0.392205
HIV1H2,HIV2KR: 0.393423
HIV1H2,HIV2RO: 0.394641
HIV1H2,HIV2SB: 0.389769
HIV1H2,HIV2ST: 0.394641
HIV1H2,SIVCZ: 0.129111
HIV1H2,Smanga_S4: 0.388551
HIV1H2,Smanga_SP: 0.388551
HIV1MN,HIV1N5: 0.0365854
HIV1MN,HIV1ND: 0.0512195
HIV1MN,HIV1OY: 0.0365854
HIV1MN,HIV1PV: 0.0439024
HIV1MN,HIV1U4: 0.0865854
HIV1MN,HIV1Z2: 0.054878
HIV1MN,HIV2CA: 0.4
HIV1MN,HIV2D1: 0.40122
HIV1MN,HIV2G1: 0.396341
HIV1MN,HIV2KR: 0.392683
HIV1MN,HIV2RO: 0.395122
HIV1MN,HIV2SB: 0.392683
HIV1MN,HIV2ST: 0.397561
HIV1MN,SIVCZ: 0.130488
HIV1MN,Smanga_S4: 0.392683
HIV1MN,Smanga_SP: 0.392683
HIV1N5,HIV1ND: 0.0341048
HIV1N5,HIV1OY: 0.0304507
HIV1N5,HIV1PV: 0.0316687
HIV1N5,HIV1U4: 0.0791717
HIV1N5,HIV1Z2: 0.0389769
HIV1N5,HIV2CA: 0.397077
HIV1N5,HIV2D1: 0.399513
HIV1N5,HIV2G1: 0.389769
HIV1N5,HIV2KR: 0.390987
HIV1N5,HIV2RO: 0.392205
HIV1N5,HIV2SB: 0.389769
HIV1N5,HIV2ST: 0.392205
HIV1N5,SIVCZ: 0.127893
HIV1N5,Smanga_S4: 0.387333
HIV1N5,Smanga_SP: 0.387333
HIV1ND,HIV1OY: 0.043849
HIV1ND,HIV1PV: 0.043849
HIV1ND,HIV1U4: 0.0767357
HIV1ND,HIV1Z2: 0.0219245
HIV1ND,HIV2CA: 0.390987
HIV1ND,HIV2D1: 0.394641
HIV1ND,HIV2G1: 0.386114
HIV1ND,HIV2KR: 0.386114
HIV1ND,HIV2RO: 0.388551
HIV1ND,HIV2SB: 0.387333
HIV1ND,HIV2ST: 0.389769
HIV1ND,SIVCZ: 0.125457
HIV1ND,Smanga_S4: 0.386114
HIV1ND,Smanga_SP: 0.386114
HIV1OY,HIV1PV: 0.0365408
HIV1OY,HIV1U4: 0.0767357
HIV1OY,HIV1Z2: 0.047503
HIV1OY,HIV2CA: 0.394641
HIV1OY,HIV2D1: 0.397077
HIV1OY,HIV2G1: 0.388551
HIV1OY,HIV2KR: 0.388551
HIV1OY,HIV2RO: 0.389769
HIV1OY,HIV2SB: 0.386114
HIV1OY,HIV2ST: 0.390987
HIV1OY,SIVCZ: 0.131547
HIV1OY,Smanga_S4: 0.388551
HIV1OY,Smanga_SP: 0.388551
HIV1PV,HIV1U4: 0.0828258
HIV1PV,HIV1Z2: 0.045067
HIV1PV,HIV2CA: 0.401949
HIV1PV,HIV2D1: 0.404385
HIV1PV,HIV2G1: 0.394641
HIV1PV,HIV2KR: 0.394641
HIV1PV,HIV2RO: 0.397077
HIV1PV,HIV2SB: 0.390987
HIV1PV,HIV2ST: 0.393423
HIV1PV,SIVCZ: 0.130329
HIV1PV,Smanga_S4: 0.388551
HIV1PV,Smanga_SP: 0.388551
HIV1U4,HIV1Z2: 0.0767357
HIV1U4,HIV2CA: 0.398295
HIV1U4,HIV2D1: 0.403167
HIV1U4,HIV2G1: 0.392205
HIV1U4,HIV2KR: 0.395859
HIV1U4,HIV2RO: 0.394641
HIV1U4,HIV2SB: 0.394641
HIV1U4,HIV2ST: 0.397077
HIV1U4,SIVCZ: 0.137637
HIV1U4,Smanga_S4: 0.400731
HIV1U4,Smanga_SP: 0.399513
HIV1Z2,HIV2CA: 0.393423
HIV1Z2,HIV2D1: 0.397077
HIV1Z2,HIV2G1: 0.387333
HIV1Z2,HIV2KR: 0.388551
HIV1Z2,HIV2RO: 0.389769
HIV1Z2,HIV2SB: 0.389769
HIV1Z2,HIV2ST: 0.389769
HIV1Z2,SIVCZ: 0.125457
HIV1Z2,Smanga_S4: 0.388551
HIV1Z2,Smanga_SP: 0.388551
HIV2CA,HIV2D1: 0.0816078
HIV2CA,HIV2G1: 0.0694275
HIV2CA,HIV2KR: 0.0645554
HIV2CA,HIV2RO: 0.0511571
HIV2CA,HIV2SB: 0.0682095
HIV2CA,HIV2ST: 0.0657734
HIV2CA,SIVCZ: 0.392205
HIV2CA,Smanga_S4: 0.125457
HIV2CA,Smanga_SP: 0.120585
HIV2D1,HIV2G1: 0.0511571
HIV2D1,HIV2KR: 0.0840438
HIV2D1,HIV2RO: 0.088916
HIV2D1,HIV2SB: 0.09257
HIV2D1,HIV2ST: 0.0864799
HIV2D1,SIVCZ: 0.397077
HIV2D1,Smanga_S4: 0.131547
HIV2D1,Smanga_SP: 0.129111
HIV2G1,HIV2KR: 0.0779537
HIV2G1,HIV2RO: 0.0730816
HIV2G1,HIV2SB: 0.0791717
HIV2G1,HIV2ST: 0.0767357
HIV2G1,SIVCZ: 0.394641
HIV2G1,Smanga_S4: 0.127893
HIV2G1,Smanga_SP: 0.121803
HIV2KR,HIV2RO: 0.0645554
HIV2KR,HIV2SB: 0.0633374
HIV2KR,HIV2ST: 0.0572473
HIV2KR,SIVCZ: 0.392205
HIV2KR,Smanga_S4: 0.118149
HIV2KR,Smanga_SP: 0.112058
HIV2RO,HIV2SB: 0.0682095
HIV2RO,HIV2ST: 0.0621194
HIV2RO,SIVCZ: 0.386114
HIV2RO,Smanga_S4: 0.120585
HIV2RO,Smanga_SP: 0.118149
HIV2SB,HIV2ST: 0.0657734
HIV2SB,SIVCZ: 0.389769
HIV2SB,Smanga_S4: 0.126675
HIV2SB,Smanga_SP: 0.123021
HIV2ST,SIVCZ: 0.394641
HIV2ST,Smanga_S4: 0.116931
HIV2ST,Smanga_SP: 0.115713
SIVCZ,Smanga_S4: 0.388551
SIVCZ,Smanga_SP: 0.388551
Smanga_S4,Smanga_SP: 0.0146163
Step3
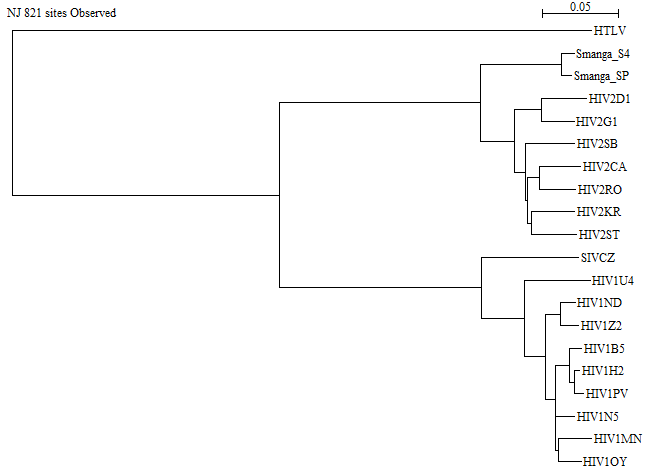
Here is a picture of the NJ tree:
The longest branch is the one leading to HTLV, which is in good agreement with the observation in the previous question.
Step 4
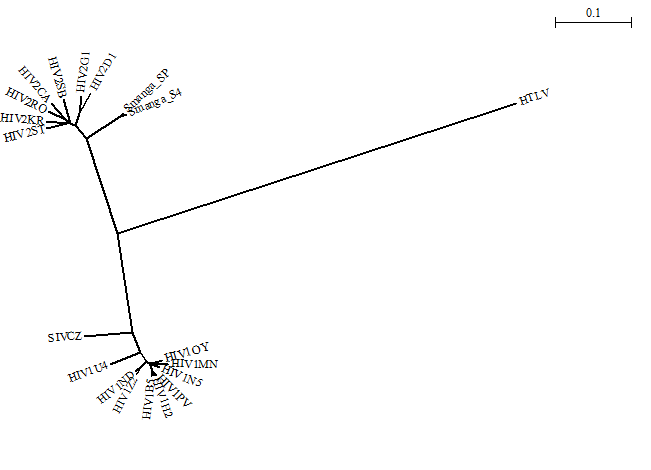
Here is an unrooted tree:
Step 5
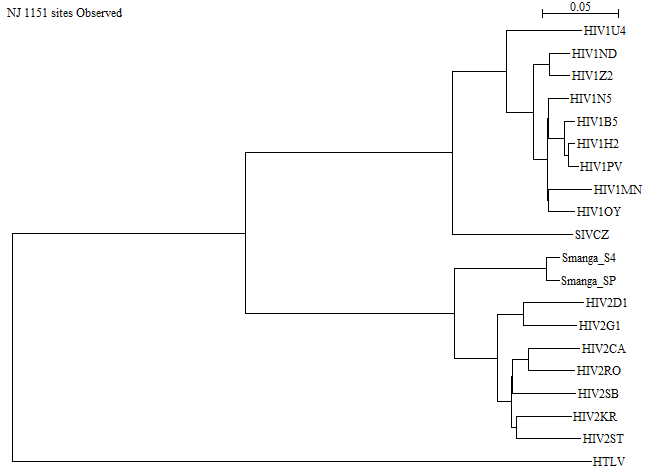
Here is a rearranged (swapped) tree:
Step 6
- The sister group to the HIV1 sequences is SIVCZ (Chimpanzee SIV).
- The sister group to the HIV2 sequences is Smanga (Sooty Mangabey SIV).
- Further answers to "The Phylogeny of HIV" can be found here.
Step 7
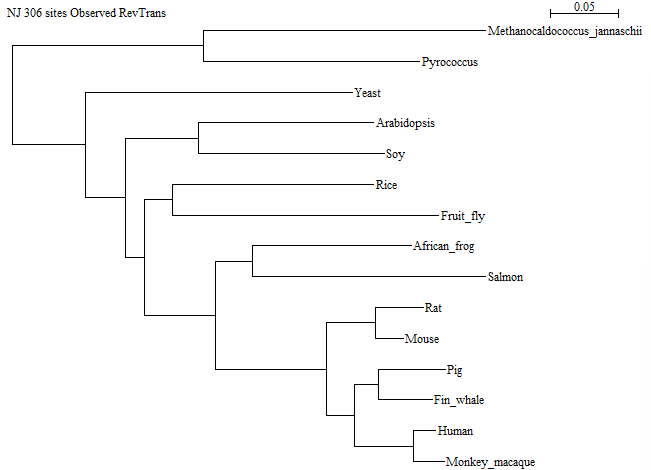
There are several correct ways of doing this, since you can choose between several alignment methods. It could be argued that RevTrans is the most correct option, since we have coding DNA, and RevTrans gives us the "best of both worlds": it takes into account amino acid similarities when aligning, while it still has the non-coding differences in the aligned DNA. The trees below have been constructed using RevTrans. However, aligning the DNA directly with Clustal Omega in Seaview produces almost identical results and leads to the same conclusion.
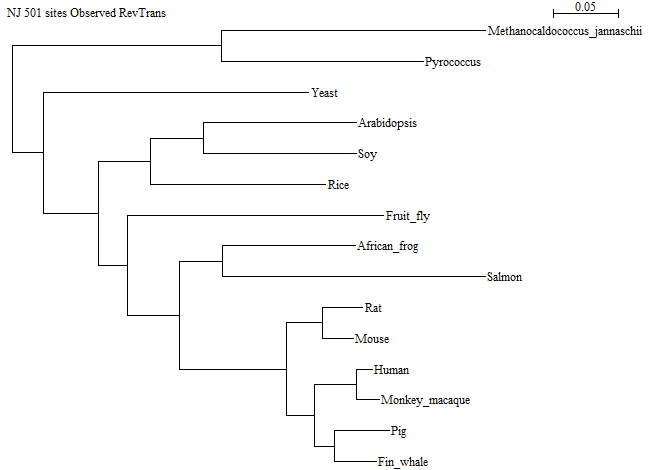
Here is the tree made ignoring gap positions:
And here is the tree made taking gap positions into account:
There is one difference in the tree topology between the two trees: In the one made without the gap positions, Rice is together with Fruit fly within the animal subtree, while in the other tree, Rice is together with the two other plants. Since Rice is a plant, the tree taking gap positions into account is the most correct one. Note: This is not always the case!
Step 8
On the whole, the structure of this tree is exactly as we would expect it, based on the known phylogeny. However, the placement of salmon and frog together in a monophyletic group is not correct. The correct species phylogeny would have salmon branching out before frog, which would branch out before the group of mammals (see illustration below). Mammals and frogs belong together in the group Tetrapoda.
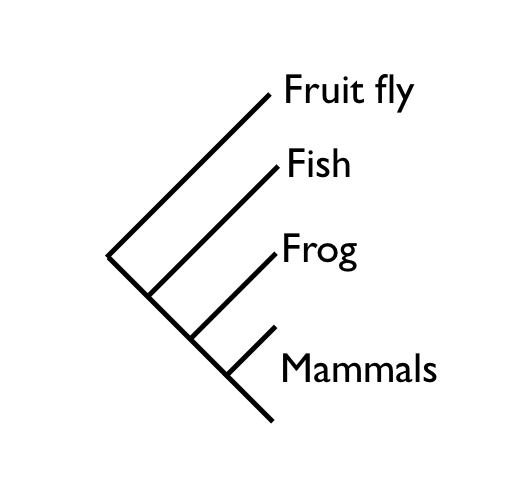
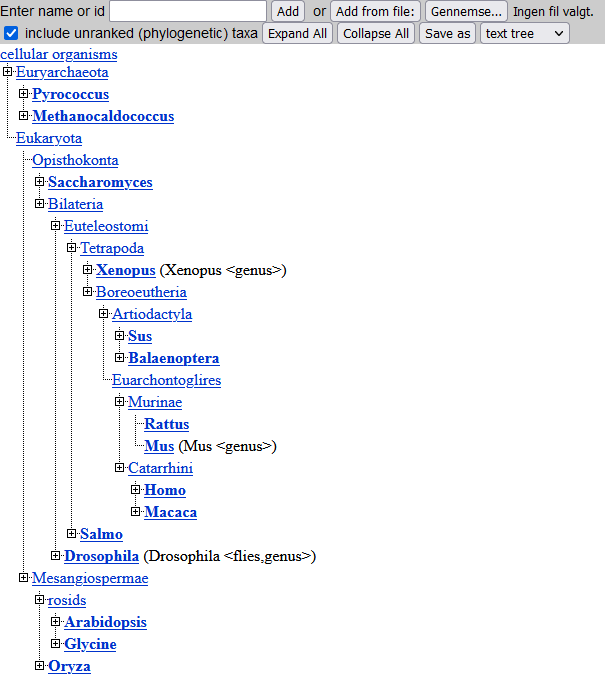
There are two additional errors, which are not as easy to detect but can be seen if all the taxa are compared using NCBI Taxonomy's "Common Tree" function (see illustration below).
First, the group of Human+Macaque is placed as a sister group to Pig+Whale, which is not correct. Human+Macaque should have been a sister group to Rat+Mouse, since primates and rodents belong together in the group Euarchontoglires.
Second, yeast is placed further from the animals than the plants are — that is also not correct. Yeast (and indeed all Fungi) actually belong together with the animals in the group Opisthokonta.
It is often seen that a phylogeny based on a single gene differs from the real phylogeny of the species. There are a number of reasons for why this happens, but one important one is simply the stochastic nature of mutations: Occasionally a gene will be most similar to the gene from a non-sister species, for entirely random reasons. This phenomenon tends to disappear as more sequence data is included in the analysis (the law of large numbers).
Step 9
- 54 results.
Search string: (protein_name:"ribosomal protein l3") AND (taxonomy_id:2759) AND (fragment:false) AND (reviewed:true) - 8 and 27 results, respectively.
Search strings: (protein_name:"ribosomal protein l3") AND (taxonomy_id:2759) AND (fragment:false) AND (reviewed:true) AND (cc_scl_term:SL-0173)
and (protein_name:"ribosomal protein l3") AND (taxonomy_id:2759) AND (fragment:false) AND (reviewed:true) AND (cc_scl_term:SL-0086)
Under the Download tab in UniProt, select "Download all", "FASTA (canonical)" and "Uncompressed". - Then use a plain text editor to combine them. Combined FASTA file is here: Ribosomal_proteins_35.fasta.txt
Step 10
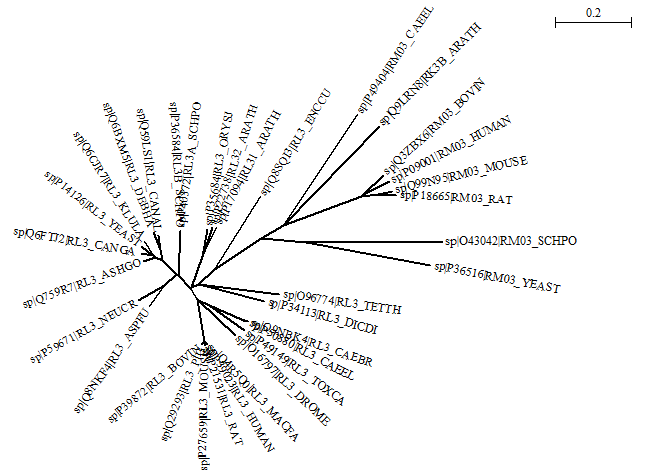
Open the FASTA file with the 34 ribosomal protein sequences in Seaview, make sure Alignment options is set to "clustalo", and align all sequences. Then make an NJ tree (with Ignore all gap sites unchecked) and change the view to "circular". Here is the result:
And here is the unrooted Newick tree file.
Step 11
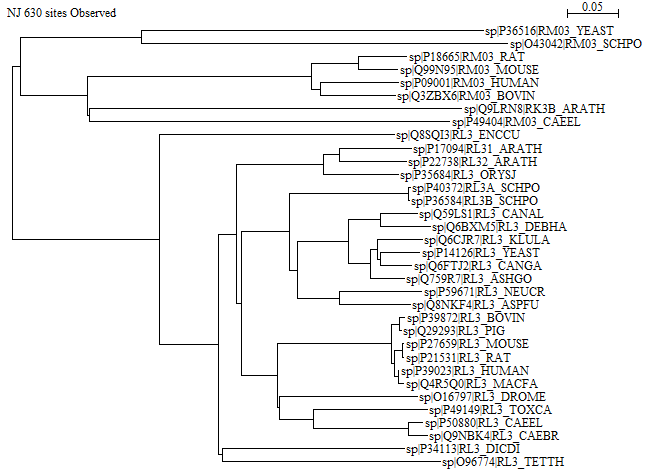
Here is the rerooted tree made by Seaview:
Step 12
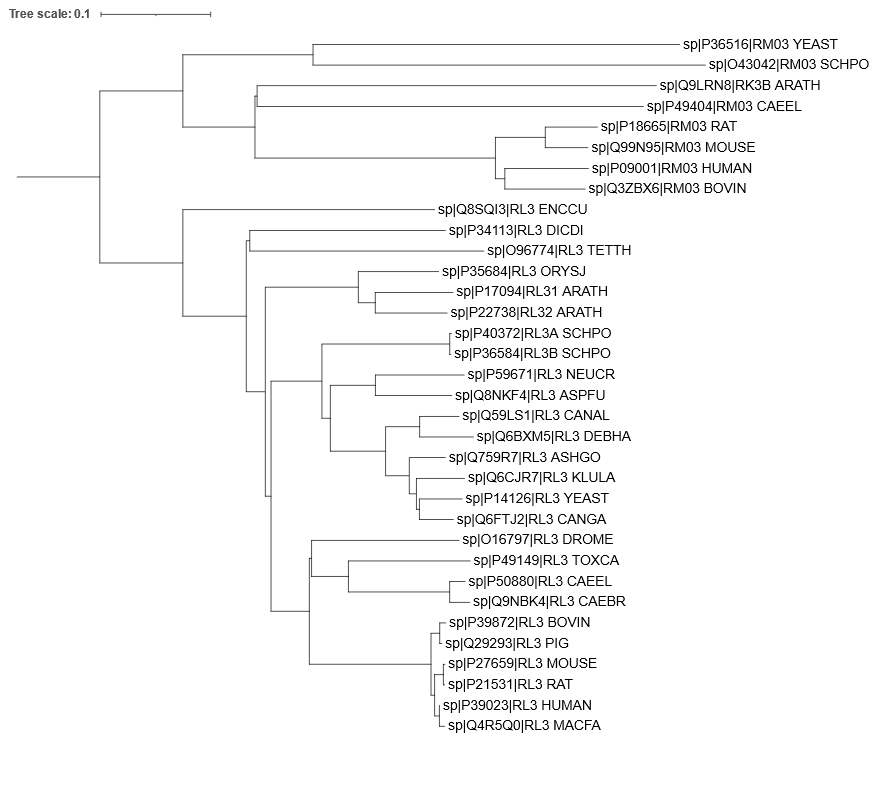
Here is the rerooted tree made by iTOL:
Yes, there is a difference: The tree from iTOL has the mitochondrial tips further to the right, while the tree from Seaview has the mitochondrial tips approximately aligned with the cytoplasmic ones. Note that when you select a branch for rerooting, the exact placement of the root on that branch is arbitrary. iTOL chooses the midpoint of the selected branch, while Seaview chooses a point that is closer to the midpoint of the entire tree. Without external information, it is not possible to say which method is most correct.
Step 13
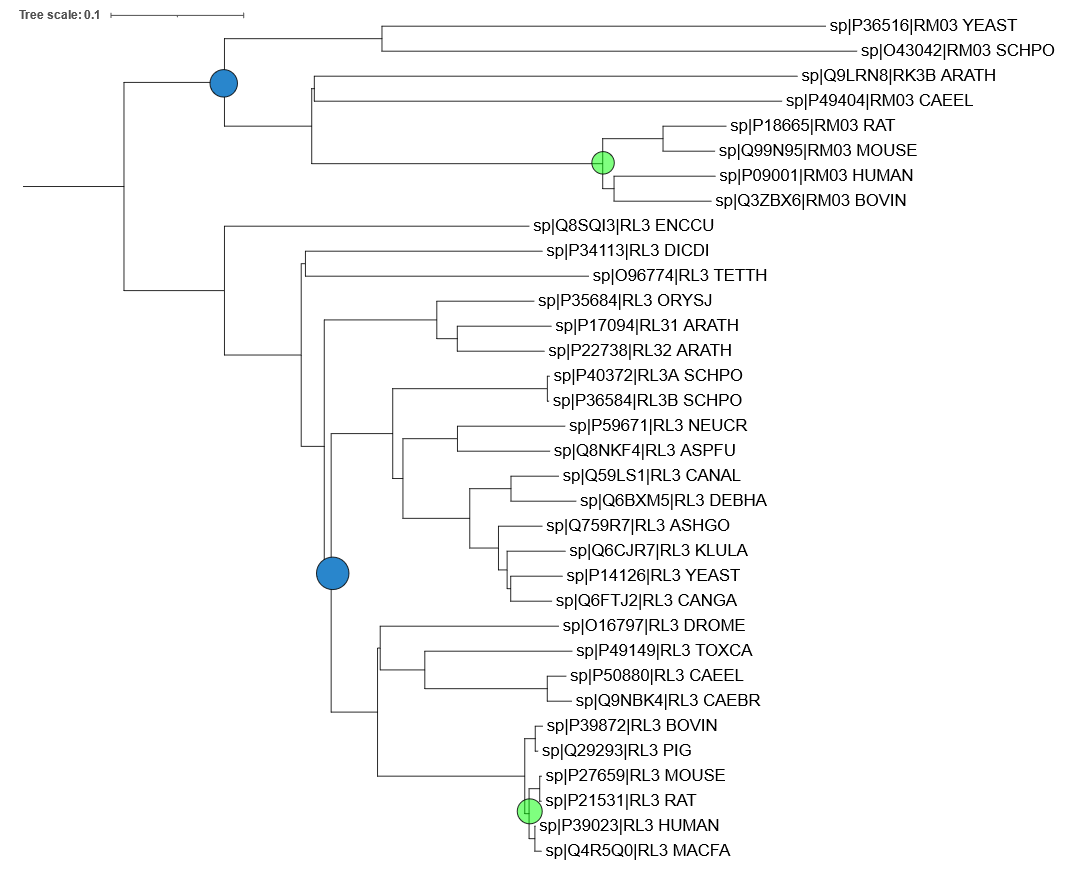
Here is the annotated tree, with blue circles marking the most recent common ancestor of human and yeast, and the green circles marking the most recent common ancestor of human and mouse:
Step 14
- The mitochondrial proteins are more closely related to each other than to their respective cytoplasmic counterparts. This could indicate that mitochondria have appeared only once in evolution.
- There are two differences: In the mitochondria, Bovine (cow) is the sister group to Human, while in the cytoplasmic proteins, Mouse+Rat comprise the sister group to Human+Macaque. Also, in the mitochondria, Yeast branches out before Arabidopsis on the way to Human, while in the cytoplasmic proteins, the plants including Arabidopsis branch out (slightly) before the fungi including Yeast. In both aspects, the cytoplasmic tree is more correct.
- There are more mutations per time unit in the mitochondrial part of the tree. This is evident from the fact that the horizontal distance between the blue and the green circle is larger in the mitochondrial subtree (by approximately a factor 2). Note that the two blue circles represent the same time point in evolutionary history, as do the two green circles. Note also that the branch lengths are proportional to the number of substitutions (accepted mutations).
