ExGeneOntology Yeast1.5
Gene Ontology - yeast cell cycle examples
Exercise written by: Rasmus Wernersson
Purpose of this exercise:
- Understand how Gene Ontology terms are defined and organized:
- The relationship between GO terms (IS A, PART OF, etc)
- The three main trunks of GO: BIOLOGICAL PROCESS, MOLECULAR FUNCTION and CELLULAR COMPONENT.
- Learn how to query the Gene Ontology database.
- Using the official online GO query system: AmiGO
- Using links from Saccharomyces Genome Database (SGD).
- Using links from UniProt.
- Understand the theory behind GO over-representation analysis
- Learn how to perform GO over-representation analysis:
- Using GOrilla
Part 1a: using the Gene Ontology terms and tools
The Gene Ontology database contains a collection of strict definitions of biological terms, and information about how the terms relate to each other (for example DNA replication is a biosynthetic process which in turn is a biological process). The Gene Ontology system is divided into three main trunks:
- Biological Process (e.g. DNA replication)
- Molecular Function (e.g. DNA binding)
- Cellular Component (e.g. Nucleus).
Each term has a UNIQUE IDENTIFIER - much in the same way, as we have it with gene identifiers in SGD (e.g. YDR224C) and protein identifiers in UniProt (e.g. POLD1_HUMAN). The Gene Ontology was created to provide a standardized way to characterize the functionality of genes (hence the name) and gene products (protein). The idea is much the same as with UniProt keywords (see the 27611 UniProt exercise for details): to have a standard set of labels that can be used to describe the gene/protein functionality: this will both 1) make it much easier to search gene/protein databases, and 2) make it much easier to perform large scale comparisons of genes/proteins.
LINKS:
- Database look-up:
- http://www.geneontology.org - the home of the Gene Ontology project
- http://amigo.geneontology.org - the AmiGO search system (the official search engine for the project)
- http://www.ebi.ac.uk/QuickGO - An alternative search system for Gene Ontology, created and maintained by the EBI. They provide a nice graphical representation of the GO trees.
- Overrepresentation analysis:
- http://cbl-gorilla.cs.technion.ac.il/ - "GOrilla - Gene Ontology enRIchment anaLysis and visuaLizAtion tool"
Many, MANY, more Gene Ontology wrappers and analysis tools exist (all based on the same data), but we'll limit ourselves to the ones listed above for the time being.
Example: "Cell division"
Gene Ontology provides a wealth of information, to the point where it can be a bit intimidating at first (it can be difficult to see the forest for all the trees). Before we start browsing the full online database, we will start out with a simple example, where we'll highlight some of the most important features, and for a moment hide the rest:
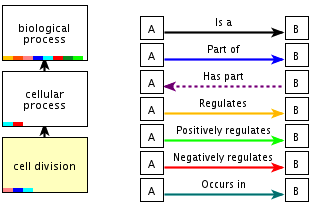
Example of the definition of a GO term ("Cell division" ; GO id: 0051301) in the biological process category, and a graph showing it's relationship to other GO terms. Note that there are 7 different types of relationships defined. The most common one is the IS A relationship.
TASK: investigate "cell division" using AmiGO 2
- Select Search -> Ontology from the top menu.
- Search for the term "cell division", and click on the entry for "cell division" at the top of the results list.
- Spend some time getting familiar with the entry page:
- The top part contains the definition(s) related to this particular entry.
- The lower part contains information about how this entry relates to OTHER entries. Try clicking on the various tabs, such as "Graph Views".

REPORT QUESTION #1:
- How many ancestor terms are defined? With how many different types of relationships?
- How many children terms are defined? With how many different types of relationships?
Cellular Component examples
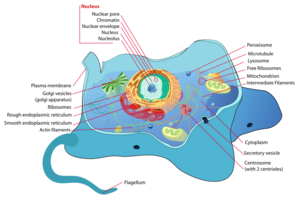
The "Cellular Component" part of Gene Ontology is good for illustrating the concept of nested terms in more details, since it's easy to visualize the boxes-in-boxes concept here.
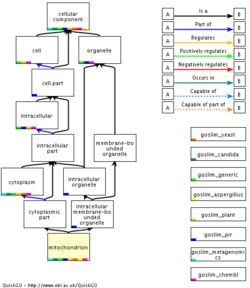
For example: The Nucleolus (the organelle for synthesis and maturation of Ribosomal RNA) is located WITHIN the nucleus which is located WITHIN the cell. While this seems trivial and evidently true, it's important to realize the concept of inherited properties within a hierarchical structure.
It's much the same case as we have previously seen with taxonomy in course 27611 - for example, if you look up Human (Homo sapiens) and Mouse (Mus musculus) in NCBI Taxonomy, the abbreviated lineages look like this:
Eukaryota › Metazoa › Chordata › Craniata › Vertebrata › Mammalia › Primates › Hominidae › Homo
Eukaryota › Metazoa › Chordata › Craniata › Vertebrata › Mammalia › Eutheria › Muroidea ›  Mus
In the GO terminology these are IS A relationships: From this we can see that all humans are primates, and all primates are mammals, but all mammals are NOT (necessarily) human.
TASK: investigate the nucleus in GO
- Look up "nucleus" (GO:0005634) in AmiGO.
- Hint: if you get a lot of hits that are not what you are looking for, try putting your query inside quotation marks ("").

REPORT QUESTION #2:
- Is "nucleus" a membrane-bound, or non membrane-bound organelle? On which linked GO terms do you base this conclusion?
- What types of relationships are found?
IS A vs. PART OF: So far we have been focusing on the "IS A" relationship (nucleus IS A organelle which in turn IS A cellular component). However, things get a bit more complicated, when we bring the "PART OF" relationship into the picture, as the next example will show.
Molecular Function examples
Continuing with our focus on cell cycle and DNA replication, investigate the following terms:
- DNA Polymerase Activity
- Helicase Activity

REPORT QUESTION #3: answer the following questions:
- Can the activities described be directed towards both DNA and RNA?
- At which node does the "tree" branch out of the "Molecular Function" ontology and into a different ontology? With what type of relationship? Does this make biological sense?
(A few more) Biological Process examples
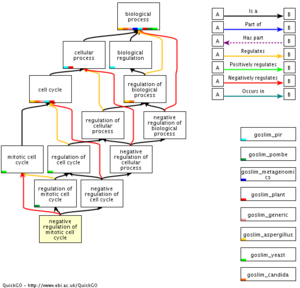
Next up we'll investigate how the different phases of the cell cycle have been categorized in GO.
- Start out by looking up the entry for the G1 phase: GO:0051318
From here you'll need to investigate the "neighborhood" of terms to answer the questions below - ask the instructor for help if you get stuck.

REPORT QUESTION #4: Mitosis related questions: (ignore meiosis for now)
- How many (if any) cell cycle sub-phases are defined for:
- G1 phase
- S phase
- G2 phase
- M phase
- Which phases are grouped together into the "interphase" term?

REPORT QUESTION #5: Meiosis related question: During meiosis the sister chromatids can exchange DNA in a process called "homologous chromosome pairing at meiosis" - you may have heard this described as "Chromosome Crossover" as well (technically crossing over is the method by with the process happens).
- In which meiotic cell cycle phase does homologous chromosome pairing at meiosis happen?
Part 1b: GO annotations on Genes and Proteins
As was mentioned earlier, Gene Ontology was created to provide a standardized set of "keywords" for annotating the function of genes and proteins. We'll now have a look at how GO is actually used in large sequence databases.
Saccharomyces Genome Database

TASK/REPORT QUESTION #6: Look the entry for POL1 (YNL102W) in SGD
- Notice that all Saccharomyces Genome Database (SGD) entries have an entire section on Gene Ontology annotations; click on the "Gene Ontology" tab for full details. This actually include a bit of extra information about the evidence for annotations.
- What is the Molecular Function for POL1?
- Click on the link for this term to see how SGD describes the GO term, and how the evidence is presented.
- How many other yeast genes are ALSO annotated to have "DNA-directed DNA polymerase activity"?
IMPORTANT: SGD also offers the possibility to jump from their website to the same GO term inside AmiGO. This is very useful for investigating the hierarchy of GO terms "above" - SGD has limited functionality for this.

TASK/REPORT QUESTION #7: Follow the link to AmiGO
- Follow the link to AmiGO for the Molecular Function term found above, and answer the following question:
- Does POL1 have "Transferase Activity"? (Which GO term).
UniProt
UniProt uses a lot of its own annotation - for example the UniProt keywords we learned to use in course 22111. However, the protein entries are also annotated with GO terms.

TASK/REPORT QUESTION #8: look up human POLD1 in UniProt:
- Entry name: DPOD1_HUMAN or P28340.
- Locate the "Function" and "Subcellular Location" sections.
- Gene Ontology:
- Select a GO term you think looks interesting and click on it - this will take you to EBI's own interface to GO.
- Click through the tabs, and see what type of information is there.
- Notice that there is NO direct link to AmiGO, but you can always copy+paste the GO identifier into AmiGO, if you want to investigate the term using a more familiar interface.
- Questions (requires a bit of detective work - ask the instructor if you get stuck):
- How many UniProt proteins are annotated with "GO:0045004 DNA replication proofreading"?
- How many of these are human? (TaxID: 9606 - use the filtering function, if you don't want to count them).
Part 2: Gene Ontology overrepresentation analysis
In this part of the exercise, we focus on performing analysis for overrepresentation in GO. We are interested in knowing if a chosen subset of genes/proteins has any special characteristics, compared to what would be expected if we picked a similar sized subset randomly from the entire pool of genes/proteins.
Study group:
- The subset (study group) could be a set of overexpressed genes from a microarray experiment, or simply a list of genes which you for other reasons expect to be involved in the same biological process.
Population group:
- The population group would then be defined as the background to compare to - e.g. the entire list of genes, or in the case of gene expression all genes represented on the microarray. We can then ask if the frequency of proteins annotation to a GO term is different for the study group compared to the overall population.
Enrichment analysis - reexamining cluster #1
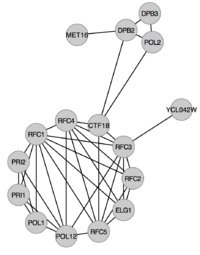
Before we move on to the more advanced statistical methods, we'll spend a moment answering the following questions:
- Is the observed frequency of a given characteristic different from the expected frequency ?
The steps to do this is simply to
- Calculate the frequency across the entire population group (X number of genes with the characteristic in a total population of Y: FX = X/Y).
- From this frequency calculate expected genes/protein with this characteristic in the study group (n = size of study group; exp = FX * n)
- Compare to the observed frequency
- The enrichment is then calculated as the ratio with observed/expected
We'll go through this with an example: in this case we want to examine whether the proteins in Cluster #1 (from last week's exercise) are overrepresented in any of the following three GO terms: "DNA replication", "DNA repair" and "Cell cycle".
All proteins in Cluster #1 are listed in the table below with a mark if they are associated with a GO term:
| Systematic name | Gene name | Description | DNA replication (GO:0006260) | DNA repair (GO:0006281) | Cell cycle (GO:0007049) |
| YMR078C | CTF18 | Chromosome transmission fidelity protein 18 | X | X | X |
| YPR175W | DPB2 | DNA polymerase epsilon subunit B | X | X | X |
| YBR278W | DPB3 | DNA polymerase epsilon subunit C | X | X | |
| YBL035C | POL12 | DNA polymerase alpha subunit B | X | ||
| YNL102W | POL1 | DNA polymerase alpha catalytic subunit A | X | ||
| YNL262W | POL2 | DNA polymerase epsilon catalytic subunit A | X | X | |
| YOR144C | ELG1 | Telomere length regulation protein ELG1 | X | X | X |
| YPR167C | MET16 | Phosphoadenosine phosphosulfate reductase | |||
| YIR008C | PRI1 | DNA primase small subunit | X | ||
| YKL045W | PRI2 | DNA primase large subunit | X | ||
| YOR217W | RFC1 | Replication factor C subunit 1 | X | X | X |
| YJR068W | RFC2 | Replication factor C subunit 2 | X | X | X |
| YNL290W | RFC3 | Replication factor C subunit 3 | X | X | X |
| YOL094C | RFC4 | Replication factor C subunit 4 | X | X | X |
| YBR087W | RFC5 | Replication factor C subunit 5 | X | X | X |
| YCL042W | YCL042W | Putative uncharacterized protein YCL042W |
In the table below are the total number of proteins listed that are involved in the three GO categories "DNA replication", "DNA repair" and "Cell cycle" across the entire yeast genome
| GO term | # genes (including subgroups) |
| DNA replication (GO:0006260) | 96 |
| DNA repair (GO:0006281) | 259 |
| Cell cycle (GO:0007049) | 313 |

TASK/REPORT QUESTION #9: Assuming yeast has 5500 annotated genes calculate/report the following values:
- Population group size
- Study group size
- Genome wide frequency of each GO term
- Expected number of genes annotated with each term in a random selection of yeast genes of the same size as cluster #1
- The enrichment of observed GO terms compared to expected
- The p-value for each GO term
The p-values can be calculated using an online calculator such as this one.
- 2021 update:: We are testing a new online calculator this year: https://www.medcalc.org/calc/fisher.php
Automated analysis using GOrilla
Introducing GOrilla
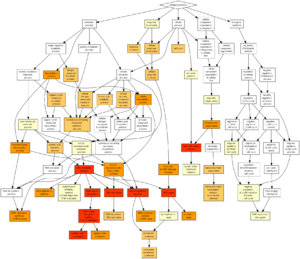
For the final part of the exercise, we'll be using an automated tool for comparison of an input gene list (study group) against a background distribution consisting of the entire yeast genome (population group). The tool we have selected will automatically calculate p-values for ALL Gene Ontology entries within the 3 main trunks of the GO system:
- Biological Process
- Molecular Function
- Cellular Component
The tool is intelligent enough to perform the test on nested categories and the results are shown both as tables with p-values, and as easy to interpret color-coded graphs (see the figure to the right). Finally it's worth mentioning, that the tool also takes care of multiple testing correction, an important problem for large scale data analysis, which we will re-visit in greater details in a later exercise.
Finally GOrilla can be run in two main modes of operation:
- List vs. background (Study group vs. population group).
- Rank based test on a single (sorted) input list.
We'll cover the list vs. background methods today, and the rank based test in next week's exercise.
LINK:
- http://cbl-gorilla.cs.technion.ac.il/ - "GOrilla - Gene Ontology enRIchment anaLysis and visuaLizAtion tool"
How to run the analysis
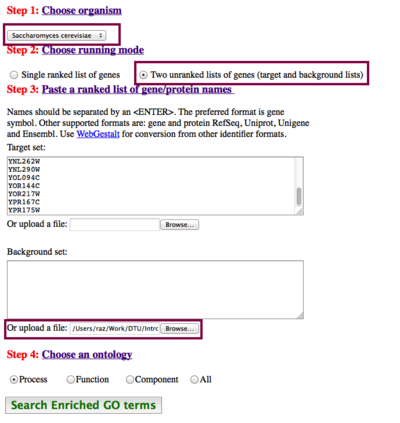
First we need to prepare our input data - we'll use the Cluster #1 as example again:
Input list: ("study group")
YMR078C
YPR175W
YBR278W
YBL035C
YNL102W
YNL262W
YOR144C
YPR167C
YIR008C
YKL045W
YOR217W
YJR068W
YNL290W
YOL094C
YBR087W
YCL042W
Background list: ("population group")
The background here will be the entire yeast genome - a list containing ALL yeast gene names. We have prepared such a list, which you can download here:

TASK: Download the data file. Place it somewhere on your computer where you can easily find it - we'll be using it a lot.
Running GOrilla:
- GOrilla needs to know which organism the gene IDs come from (it does not have the functionality to autodetect it), in order to load the correct subset of Gene Ontology. Luckily, yeast is among the supported organisms.
- Choose the running mode (two unranked lists)
- Paste in input list
- Upload background list
- Select which part of Gene Ontology you want to compare against.
(See the figure to the right for a summary)

TASK/REPORT QUESTION #11: Run the analysis for cluster #1 for all three GO trunks (Biological Process, Molecular Function and Cellular Component), and include the graphs in your report. Do the results fit with what we have previously learned about the function of cluster #1?
Analyze selected clusters using GOrilla
![]() As the final task of today's exercise we'll be re-visiting the 10 clusters from last week's exercise. What we'll need here is lists of gene names for each cluster. The easiest way to do this is to reuse the Excel sheet with functional annotation you made last week.
As the final task of today's exercise we'll be re-visiting the 10 clusters from last week's exercise. What we'll need here is lists of gene names for each cluster. The easiest way to do this is to reuse the Excel sheet with functional annotation you made last week.
Re-analyzing all 10 clusters will likely take too long for this exercise, as it takes some manual effort to run GOrilla. Instead select the 3 clusters which appear the most interesting to you.

TASK/REPORT QUESTION #12: perform the following over-representation analysis and create a short report documenting you finding:
- Biological Process
- Molecular function
- Cellular component
- Question:
- Do the results make biological sense?
- How do these results compare to the broad categories we observed in the previous exercise?
