Uncategorized files
Jump to navigation
Jump to search
Showing below up to 31 results in range #1 to #31.
-
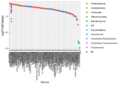
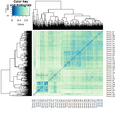 Bc heatmap.png 564 × 532; 209 KB
-
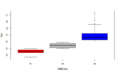 Bmi class.png 880 × 532; 4 KB
-
 Comparing richness.png 434 × 288; 4 KB
-
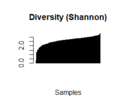
 Comparing shannon.png 880 × 670; 8 KB
-
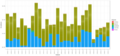
 Comparing species abundance.png 880 × 670; 10 KB
-
 DDseq 100OTU.png 1,962 × 1,395; 323 KB
-
 DDseq 350OTU.png 1,962 × 1,395; 446 KB
-
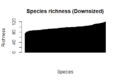 Downsized richness.png 434 × 288; 3 KB
-
 Downsized sampledepth.png 426 × 291; 4 KB
-
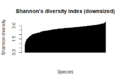 Downsized shannon.png 434 × 288; 4 KB
-
 Full tree.png 4,042 × 2,749; 792 KB
-
 Gtdbtk.pdf 0 × 0; 292 KB
-
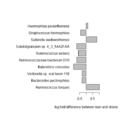 Log fold diff sign.png 564 × 532; 8 KB
-
Microbial genomics course22126 slide1-30 compressed.pdf 0 × 0; 1.3 MB
-
Microbial genomics course22126 slide31-75 compressed.pdf 0 × 0; 1.94 MB
-
-
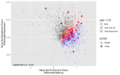
 Pca.png 1,193 × 532; 14 KB
-
 PrincipalComponents.png 900 × 565; 53 KB
-
 Raw richness.png 282 × 247; 2 KB
-
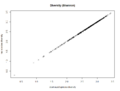
 Raw richnessVSshannonZoom.png 636 × 482; 5 KB
-
 Raw sampledepth.png 426 × 291; 4 KB
-
 Raw shannon.png 282 × 247; 2 KB
-
 Rawkaijubar.png 900 × 417; 61 KB
-
 Rnaseq fig1.png 1,536 × 960; 373 KB
-
 Rnaseq fig2.png 1,536 × 960; 376 KB
-
 Rnaseq fig3.png 1,536 × 960; 373 KB
-
 STunknown removed tree.png 3,907 × 2,323; 674 KB
-
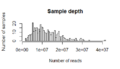 Sample depth.png 428 × 247; 3 KB
-
 Slide pa distribution.png 960 × 540; 40 KB
-
 Spectrum.03295-24-s0001.docx ; 605 KB
-
 Wilcoxon significant.png 564 × 532; 4 KB


