ExYeastCellCycleTranscriptomics2 R
Yeast cell cycle / transcriptomics exercise #2
Exercise written by: Rasmus Wernersson and Lars Rønn Olsen
PART 1: Network analysis of the Alpha Factor Arrest data

IMPORTANT: We continue working with the data set from week 4.
Network analysis
The final part of the analysis of the alpha-factor arrest data set we started in the previous exercise, is to map it onto the Yeast protein-protein interaction network we worked with in week 4.
TASK: reload base session, prepare Excel data for import
load("/home/projects/22140/exercise4.Rdata")
load("/home/projects/22140/exercise6.Rdata")
# Calculate log2fc from expression
expr$log2fc <- log2(expr$GSM287992/expr$GSM287991)
# Add log2fc to your node attribute table
node_attributes_updated <- merge(x = node_attributes, y = expr[!duplicated(expr$SysName),c(1,6)], by.x = "ID", by.y = "SysName", all.x = TRUE)
# If you haven't worked with the "merge" command, take a moment to understand the line above. It's a super useful command
TASK: Visualize the Log2(FC)
- Plot the network using ggraph with the following mappings:
- Color nodes by log2FC
- Use the "scale_color_gradient2" argument to ggraph to color down regulated nodes blue, (mid color gray), and up regulated red
scale_color_gradient2(low = "red", mid = "gray", midpoint = 0, high = "blue")
- Set node shape based on whether the log2fc is lower than -2 or higher than 2. Hint:
shape = abs(log2fc)>2)
The next task is to have a look at the network and try to interpret the results. Here it should be noted that the cells have been arrested in what may be a bit "boring" part of the cell cycle (late G1), but we can still make a few interesting observations.

REPORT QUESTION #1: Inspect the network
- Can you find any clusters (even small ones) with several genes being regulated in the same direction?
- Discuss the biological meaning of this within the group (note that not all clusters are super-easy to interpret).
- Which of the KAR genes are regulated?
- Include a screenshot of the network in your report
PART 2: Arrest and Release time-series experiment
The "alpha-30/alpha-38" arrest and release experiments

For the first part of the exercise we'll be working an alpha-factor arrest-and-release experiment (the "alpha-30/alpha38" experiment from the Breeden lab). Briefly, the experimental set-up is as follows:
- ARREST: The culture was arrested using alpha-factor (as we have seen before).
- RELEASE: When most of the cells had been arrested in cell cycle, the cells were spun down, and re-suspended in fresh media (thus removing the alpha-factor).
- SAMPLING: small samples were collected from the culture at 5-minute intervals following release (and experimental tricks were used to quickly kill the cells and protect the RNA).
- ARRAY ANALYSIS: for each timepoint the synchronized cells were compared to an asynchronous culture on a two color array (competitive hybridization) using Cy3 and Cy5 labeling.
- DYE SWAP: The experiment was carried out twice, once with CASE (Cy3) vs. CONTROL (Cy5) and once with CASE (Cy5) vs. CONTROL (Cy3) - this is done to eliminated technical biases in the labeling process.
Understanding the data
TASK: find the "alpha-30" experiment in GEO"
- Search for the accession ID: GSE4987

REPORT QUESTION #2:
- Find the title of the publication describing the experiment.
- How many arrays (measurements) are associated with the experiment?
CLEANED UP DATA:
- From the data available for download at GEO (the MATRIX file mentioned above), we have prepared an extract (and very slight reformatting) of the data we need for this exercise.
load("/home/projects/22140/exercise7.Rdata")
- The data frame "alpha30_38" contains the data in long format. Take a minute to explore the data frame. The log2fc is the fold change between the two conditions case and control. In the alpha30 experiment, fold change is case = Cy3 / control = Cy5. In alpha38 the dyes were swapped and hence control = Cy3 / case = Cy5
Estimating the inter-division time
Before we move on with the analysis of biology described by the data, we need to have a better understanding of how the time series relates to the cell cycle. We'll start out by estimating the inter-division time (number of minutes it take for a full cell cycle).
This can be done by simply plotting the expression profiles of a few genes that we expect to follow a cyclic pattern in the data set, for example:
RAD53 [YPL153C] G1 (mid)  DNA repair/cell cycle arrest
CLN1  [YMR199W] G1/S1     G1-cyclin - controls entry to the S-phase
HTB2  [YBL002W] S (mid)   Histone H2B - histones are needed for the new chromosomes
CLB1  [YGR108W] G2 (mid)  B-type cyclin
ASH1  [YKL185W] M (late)  Transcriptional regulator (during anaphase)
TASK: below is a hint how to use ggplot to plot x = timepoint and y = log2fc
# all in one
df <- alpha30_38[alpha30_38$gene %in% c("YPL153C", "YMR199W", "YBL002W", "YGR108W", "YKL185W") & alpha30_38$experiment == "alpha30",]
ggplot(df, aes(x = timepoint, y = log2fc, color = gene)) +
  geom_point() +
  geom_line() +
  ggtitle("alpha30")

# or one at the time if you prefer
ggplot(df, aes(x = timepoint, y = log2fc, group = gene)) +
  geom_point() +
  geom_line() +
  facet_wrap(~gene) +
  ggtitle("alpha30")

REPORT QUESTION #3: Estimate inter-division times
- Start out by plotting the graphs using the code above for the 5 genes for the CASE vs. CONTROL part of the data ("Cy3/Cy5" - "Alpha30")
- Estimate the distance between the peaks (just look at them), and report the results in minutes:
- RAD53/YPL153C:
- CLN1/YMR199W:
- HTB2/YBL002W:
- CLB1/YGR108W:
- ASH1/YKL185W:
- Include the plot in your report

REPORT QUESTION #4: Estimate inter-division times again - this time from the CONTROL vs. CASE data
- Plot the graph for the five genes using the dye swap data ("Alpha38"), and report the estimated inter-division times in minutes:
- RAD53/YPL153C:
- CLN1/YMR199W:
- HTB2/YBL002W:
- CLB1/YGR108W:
- ASH1/YKL185W:
- Include the plot in your report
- CONCLUDE:
- Is there good agreement about the inter-division time?
- Make a combined estimate about the "true" inter-division time
- How many cell divisions do the time series cover?

REPORT QUESTION #5: cyclic genes - what should be expected?
- Think about this: if you pick a handful of random genes from the big data matrix (that is, across the entire genome), would you expect them to follow a cyclic pattern with the inter-division time you have just estimated above?
- To back up your argumentation you are welcome to make an expression plot of 10 randomly selected genes.
A brief look at the dye-swap experiment

REPORT QUESTION #6:
- Select 1-2 of the cyclic genes from the table above, and make one plot for each gene showing the expression data for both "normal" and "dye-swap".
- Do the two expression profiles (for each gene) follow a pattern you would expect?
- Include your plot(s) in the report.
Mapping the cell cycle phases onto the time points

From your observations above (the phases of the 5 genes listed in the table), it should be possible to do a rough mapping from time in minutes to cell cycle phases.

REPORT QUESTION #7:
- Make a table (e.g. Excel, Word, text-based) where you map the time in minutes (0-120) to an estimate of the corresponding point in cell cycle.
- Hint: start by mapping out the known peaks, and fill in the rest from there.
- Include the table in your report.
- SANITY CHECK: Is your table in alignment with the fact that Alpha-factor arrest is linked to the G1/S phase transition?
Network analysis of the time-series data
TASK:
- Add the log2fc and timepoint from alpha30 experiment to your node attribute table using the "merge" function.

TASK:
- Reload a graph object with the updated node attribute table

REPORT QUESTION #8:
- Select one time point in the S-phase and one in the M-phase based on your work above.
- Report the selected time points in minutes.
- For each of the 2 time points, plot the network with nodes colored by log2fc:
- Which of the previously defined clusters 1-8 appear to be up/down regulated in this cell cycle phase?
- Document your finding with a few screenshots of selected clusters
- Is this in good agreement with our previous functional analysis of the clusters?
PART 3: Combined arrest-and-release experiments and peak-time


As the final part of the exercise, we investigate what we can learn from an integrative analysis of entire cell cycle data sets. As we have discussed in today's lecture the idea is to perform the following analysis:
- Use a mathematical model to determine which of the genes are periodically expressed.
- As part of this analysis estimate the peak time of all the periodically expressed genes.
The "data alignment" problem
In order to use data from multiple different experiments we need to overcome a few difficulties - most importantly:
- The growth conditions may be different (e.g. medium and temperature) leading to different inter-division times
- Different arrest methods halt the cell division in different stages (meaning that "time-zero" is not in the same phase).
- The experiments may last a different number of cell divisions (typically 1.5 - 2.5).
![]() QUESTION/DISCUSSION POINT: - discuss the following in the group (you don't need to put it in your report)
QUESTION/DISCUSSION POINT: - discuss the following in the group (you don't need to put it in your report)
- What steps would be needed in order to make two experiments comparable?
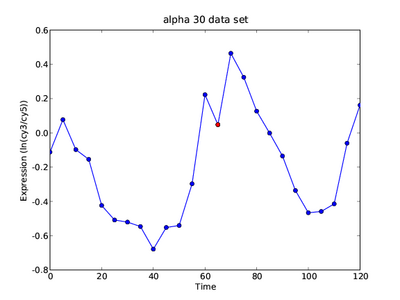
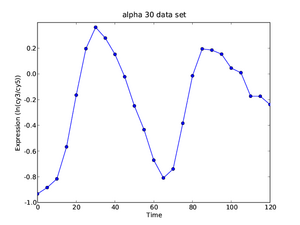
- Hint: Use the curves of HTB2 shown to the right as the basis of the discussion.
Introducing Cyclebase.org
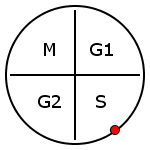
Here will use the online resource cyclebase.org, which is dedicated to cell cycle analysis, and which contains a lot of easy-to-browse information about which yeast genes are periodically expressed. Note that from the circle plot you can get extra information by hovering your mouse over each section for 2-3 seconds.

TASK/REPORT QUESTION #9:
- Go to cyclebase.org and look up the PEAK TIME (in percent of cell cycle) for the 5 genes we have already worked with:
- RAD53/YPL153C:
- CLN1/YMR199W:
- HTB2/YBL002W:
- CLB1/YGR108W:
- ASH1/YKL185W:
As is evident from the very detailed pages for each gene at cyclebase.org, quite a lot of advanced analysis went into boiling down the information contained in the experiments into a few key numbers. Here, we only need to concern ourselves with the PEAK TIME (and then we, for now, trust that the authors did a decent job at finding the periodically expressed genes).

TASK: download data
- Most data from CycleBase is available for download at: CycleBase download as TEXT files that are pretty easy to work with.
- However, in order to save some time, we have prepared a data frame, "peaktime", which contains the most important information for the periodic genes (you will find it in the data for exercise 7)
Quoting from CycleBase:
The peaktime describes when in the cell cycle a gene is maximally expressed. Peaktime is calculated as a percent, with both 0 and 100 representing the M/G1 transition in the cell cycle. These percents are displayed as discrete phases or transitions of the cell cycle.
A peaktime for a single expression profile first requires that a sine wave be fitted to the profile. The algorithm scans through all possible offsets and selects the sine wave that has the best correlation with the observed expression profile. The peaktime is then computed as the peak of this sine wave.
To compute a peaktime for a single gene across all available experiments, the time scale was 'shifted' such that time was represented as a fraction of the cell cycle. In this scale, both 0 and 100 correspond to the M/G1 transition. As experiments with not very periodic profiles produce poor peaktimes, the combined peaktime was weighted to take this into account.

TASK/REPORT QUESTION #10:
- Extract all the genes with a peaktime within +/-5 of the gene HTB2
Network analysis of peak-time data
![]() OPEN ASSIGNMENT: this requires some work on your own, dialogue within the group
OPEN ASSIGNMENT: this requires some work on your own, dialogue within the group
- STEP 1: Map the peak-time data into the Yeast PPI network (create a new work session), and make a discrete color-code showing the peak-time:
- G1-phase: 1-25
- S-phase: 26-50
- G2-phase: 51-75
- M-phase: 76-100
- (find a good neutral color for nodes with no data)
- STEP 2: find regulated clusters
- Party hubs: Any clusters with a clear peak-time signal? Are all members periodically expressed?
- Date hubs: Any clusters with key proteins interacting with different proteins throughout the cell cycle?

TASK/REPORT QUESTION #11:
- Document your findings as best as you can - include figures where needed (and remember to explain the color-coding).