DiscoNet answers
Human diseases / virtual pulldown exercise
Exercise written by: Lars Rønn Olsen, Giorgia Moranzoni, and Rasmus Wernersson

TASK/REPORT QUESTION #1:
- Load the packages
library(DiscoNet)
library(msigdbr)
library(fgsea)

The PPI database we will use is InWeb:
load(file='/home/projects/22140/inweb_reduced.Rdata')
- Run DiscoNet with this list of proteins with the following parameters:
network_ex2 <- virtual_pulldown(seed_nodes = seed_nodes_ex2, database = db, id_type = "hgnc", zs_confidence_score = 0.156)
interactions <- data.frame(network_ex2$network)
node_attributes <- data.frame(network_ex2$node_attributes)
node_attributes <- merge(x = node_attributes, y = pt, by.x = "nodes", by.y = "gene", all.x = TRUE)
- Convert network into igraph object with the following relevance score cutoffs: 0, 0.5, 1
g <- graph_from_data_frame(interactions, directed = FALSE, vertices = node_attributes)
g1 <- relevance_filtering(g, 0)
g2 <- relevance_filtering(g, 0.5)
g3 <- relevance_filtering(g, 1)
- Look at the size of the filtered/scored networks to get an impression of how the network is narrowed down as the confidence score cut-off is raised
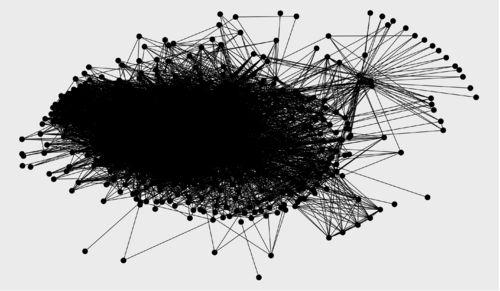
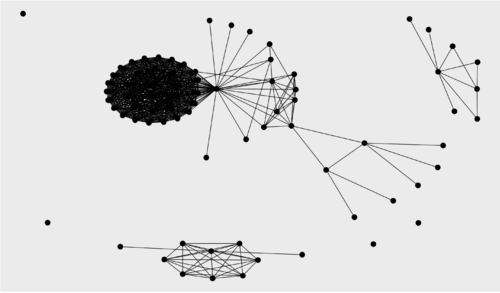
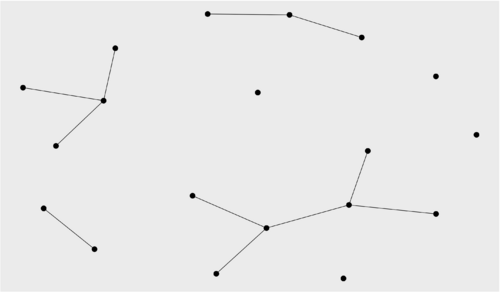
Relevance score cutoff 0 (no filtering): 452 nodes, 8806 edges Relevance score cutoff 0.5: 77 nodes, 649 edges Relevance score cutoff 1: 19 nodes, 11 edges
- How many proteins (nodes) and how many interactions (edges) are reported when a 0.2 threshold is applied? How does that compare to the full network (no cutoff)? Explain difference.
Relevance score cutoff 0.2: 242 nodes, 4766 edges We observe approximately half the number of nodes and edges with a cutoff of 0.2. This means that only half the nodes had at least 20% of the edges within the network. The other half had less than that. It's unlikely that half the proteins in the unfiltered network were sticky proteins, but they probably had more to do outside the network than inside, so filtering them could be a good idea.
Visualizing networks
TASK: Get ready to visualize the three graphs (relevance score cutoffs 0, 0.5, 1) using ggraph.
ggraph(g1, layout = "kk") +
  geom_edge_link() +
  geom_node_point(size = 5)

ggraph(g2, layout = "kk") +
  geom_edge_link() +
  geom_node_point(size = 5)

ggraph(g3, layout = "kk") +
  geom_edge_link() +
  geom_node_point(size = 5)

REPORT QUESTION #2":
- Include screenshots of the networks in your report
Protein complex detection
Next up, we will use the MCODE algorithm to detect potential protein complexes. The can be done with the "community_detection" function of DiscoNet:
mcode_network <- community_detection(g1, algorithm = "mcode")
REPORT QUESTION #3":
Examine the resulting communities. Which one do you think may be molecular complexes and why? Paste an example of a community you believe could be a protein complex, and one you don't believe is a protein complex.
communities <- community_detection(g1, algorithm = "mcode")
MCODE produces the following communities:
lapply(communities[[1]], function(x) paste(vcount(x), ecount(x)))

[[1]]
[1] "364 8311"

[[2]]
[1] "5 8"

[[3]]
[1] "3 3"

[[4]]
[1] "3 3"
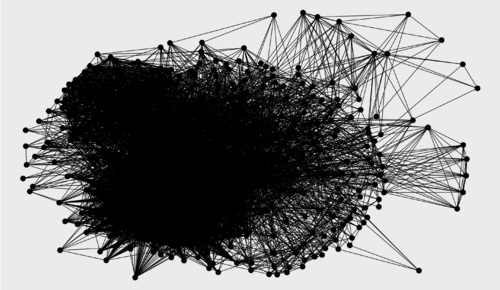
Based on what we have learned, the community 1 is definitely to large to be a protein complex (protein complexes should have more than maybe 30-40 proteins, and mostly likely less than that. The rest could be good candidates, so let's visualize community 1 (bad example) and 2 (good example)
ggraph(communities[[1]][[1]], layout = "kk") +
  geom_edge_link() +
  geom_node_point(size = 5)

ggraph(communities[[1]][[2]], layout = "kk") +
  geom_edge_link() +
  geom_node_point(size = 5)
Which produces
Functional classification
For the next part, we'll try to identify the function of the proteins we have found by performing Gene Ontology over-representation analysis of sub-clusters with-in the network.
This can be done with the fgsea package.
Start by loading the background gene list:
load("/home/projects/22140/exercise9.Rdata")
Run fora on all potential protein complexes:
As we saw in the previous question, community 2, 3, and 4 could be potential complexes
library(fgsea)
library(msigdbr)
BP_df = msigdbr(species = "human", category = "C5", subcategory = "BP")
BP_list = split(x = BP_df$gene_symbol, f = BP_df$gs_name)

head(fora(pathways = BP_list, genes = V(communities$communities[[2]])$name, universe = all_gene_ids))
head(fora(pathways = BP_list, genes = V(communities$communities[[3]])$name, universe = all_gene_ids))
head(fora(pathways = BP_list, genes = V(communities$communities[[4]])$name, universe = all_gene_ids))

TASK/REPORT QUESTION #4:
- Discuss the interpretation of the most significant results for each of the communities that could be protein complexes. Do they make biological sense in the context of heart disease?
It's immediately clear that complex 2 is involved in cardiac development:
1:                                       GOBP_CARDIAC_VENTRICLE_MORPHOGENESIS 6.443594e-16 4.934504e-12
2:                                         GOBP_CARDIAC_CHAMBER_MORPHOGENESIS 1.047694e-14 2.674414e-11
3:                                         GOBP_CARDIAC_VENTRICLE_DEVELOPMENT 1.047694e-14 2.674414e-11
4:                                           GOBP_CARDIAC_CHAMBER_DEVELOPMENT 4.371267e-14 8.368790e-11
5: GOBP_CELL_SURFACE_RECEPTOR_SIGNALING_PATHWAY_INVOLVED_IN_HEART_DEVELOPMENT 1.045901e-13 1.601902e-10
6:                                                   GOBP_HEART_MORPHOGENESIS 3.705408e-13 4.729336e-10
Same for complex 3:
1:                                          GOBP_GERM_CELL_MIGRATION 0.0002322131 0.6914851       1    6
2:             GOBP_CARDIAC_MUSCLE_CELL_CARDIAC_MUSCLE_CELL_ADHESION 0.0002709118 0.6914851       1    7
3:            GOBP_PROTEIN_MODIFICATION_BY_SMALL_PROTEIN_CONJUGATION 0.0003764297 0.6914851       2  872
4:                 GOBP_AV_NODE_CELL_TO_BUNDLE_OF_HIS_CELL_SIGNALING 0.0004256966 0.6914851       1   11
5: GOBP_PROTEIN_MODIFICATION_BY_SMALL_PROTEIN_CONJUGATION_OR_REMOVAL 0.0005195136 0.6914851       2 1025
6:             GOBP_AV_NODE_CELL_TO_BUNDLE_OF_HIS_CELL_COMMUNICATION 0.0005417747 0.6914851       1   14
