QuantitativeMetagenomicsSolution
Q1. How many samples do we have and how many genes?
> str(Counts)
 int [1:251436, 1:401]
251436 genes and 401 individuals
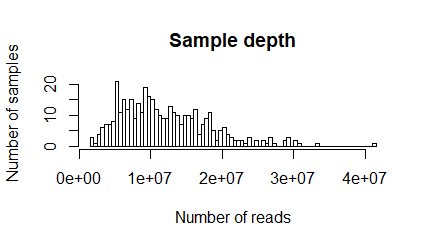
Q2. What's the sample depth range?
> range(sampleDepth)
[1]  1533776 41391478
1533776 to 41391478
The figure shows the number of samples (persons) on the y-axis containing the displayed number of reads on the x-axis
Q3. How many species are there in total?
 str(taxCounts)
 int [1:120, 1:401]
120 species
Q4. What does a high Shannon diversity index mean?
A high Shannon diversity index means that there are many species present with equal abundance. Typical values are generally between 1.5 and 3.5 in most ecological studies, and the index is rarely greater than 4. The Shannon index increases as both the richness and the evenness of the community increase.
Q5. Which threshold did you choose and why? How many samples did you lose?
A good guestimate is 3e6, where we remove 8 samples.
Q6. What is the effect on downsizing on the richness
Lowering the richness
Q7. What is the effect on downsizing on diversity (Shannon)
No effect, the Shannon index is biased more toward evenness than richness. Since richness weighs rare species just the same as abundant species, this implies that the Shannon index gives more significance to common species.
Q8. Is there any significant difference in abundance of E. coli between the different BMI groups?
No, the p-value is 0.146
Q9. How many species are significant with an FDR < 0.05?
Only 1
Q10. Can you see any differences in the abundances - which species have large differences, what are their p-values?
Yes, there are differences, especially Ruminoccocus torques is significantly different.
Q11. What type of bacteria is the most significant one? [try google]
Ruminoccocus torques is a fairly common gastrointestinal bacteria.
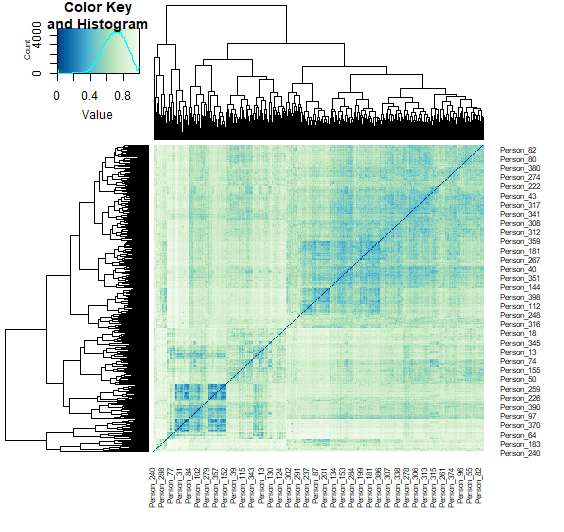
Q12. Can you see some clusters of samples?
Yes, a Bray-Curtis dissimilarity of zero indicates high similarity and we do see clusters of blue.
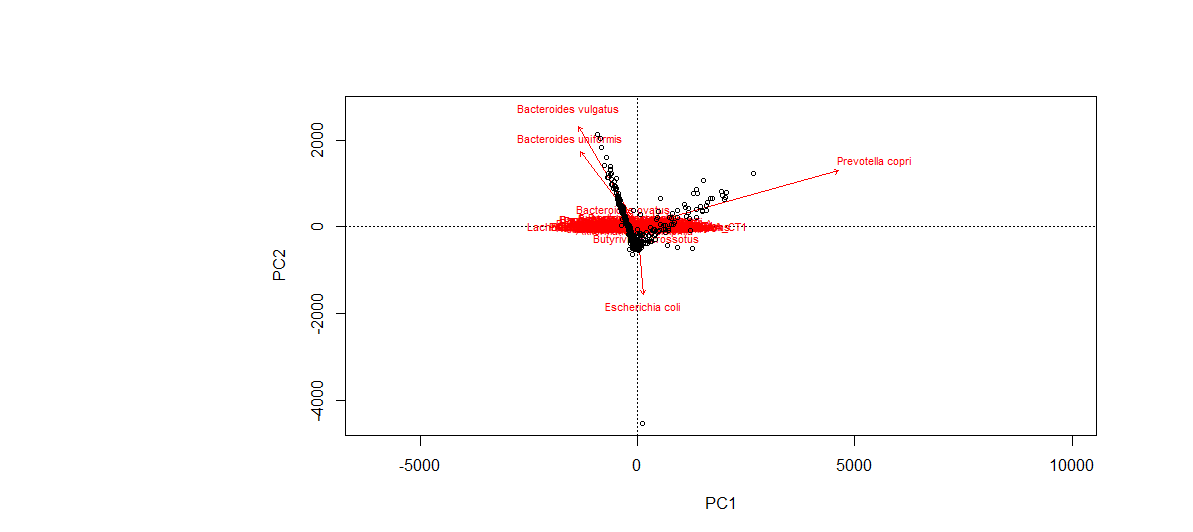
Q13. Can you see which species that seems to be driving the differences between the samples?
Yes, they are indicated in red vectors.
Q14. which are the most significant species? Is there an overlap between these and using the downsizing+wilcoxon test (what you did above)?
We get much higher significance and the literature suggests actual relevance for obesity.
Please find answers here


