Resistance to antibiotics
Description
Bacterial resistance to antibiotics is a growing problem, and there is many real life scenarios where it is important to understand what type antibiotics will be effective on a patient or what kind of resistance can be expected in certain bacterial populations - or even what kind of antibiotics has the farmer been feeding his pigs.
Given a "database" of bacterial resistance genes as a fasta file and a FASTQ file where a metagenomics sample has been sequenced from a stool/blood/sewage/pig feces/whatever you must identify which resistance genes are in the sample.
It must be understood that the sample is a mix of many different bacteria with a greater or lesser amount of the bacterial species. You do NOT sample a single bacteria.
Method

The resistance genes are "just" dna sequences and likewise are the reads in the FASTQ file. A k-mer is defined as a piece of sequence of k size. Normally k is set to a certain size depending on the problem. By making a database/data structure of all k-mers of the resistance genes, then one can cut out a k-mer from a read in the sample and see if it matches. In case of a match the read might be from bacterial dna which has a resistance gene.
In the project set the size of the k-mer to 19. That is fairly reasonably as we want the k-mer to be unique and that happens around 17+ for human sized genomes. You can experiment with other sizes if you feel like it.
There is no way of knowing if the reads come from one strand or the other - so try both.
There are several difficulties in identifying the resistance genes accurately, which must be dealt with. This project must handle the following two.
1) Some genes are very close in the sequence. It might just be one or two SNP's difference. How to differentiate between the genes?
2) NGS is notoriously unreliable. You can not be sure that the read is actually correct. This is also why the longer k-mer you use, the greater chance of it being incorrect. How to know that you can trust that you have found a resistance gene in the sample?
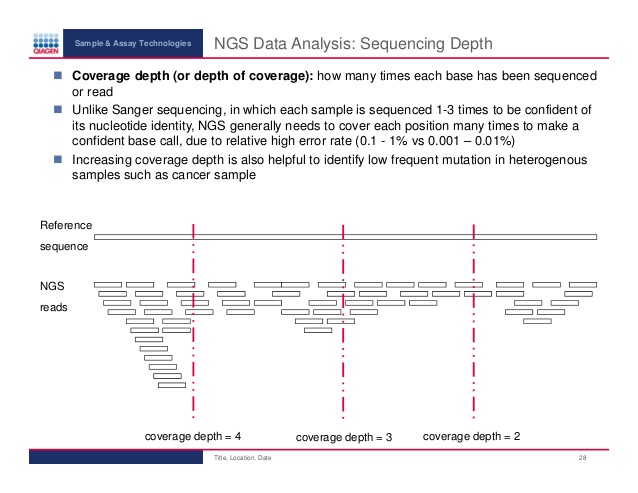
The answers to both problems are in the sampling. Every base in the sample has been sequenced to at depth of around 50, i.e. sampled 50 times. Since the genomic material is fairly abundant and then cut randomly and sequenced then the reads are (mostly) overlapping. So when you check the k-mers of the sample against the k-mers in the resistance database then the entire gene must have been covered, thus solving 1). If this coverage is also at a good depth, then 2) is solved as it is not a match by random mis-sequencing. K-mers which only occur few times are due to sequencing errors.
The sequence depth can vary, as you get what you pay for - more depth is more expensive, but within that, the depth also vary depending on the gene being on the genome, a low-copy plasmid or high-copy plasmid. It is highly desired to have a high depth, as that makes the results more reliable.
It may happen that a k-mer in a read accidentally matches a k-mer in the resistance gene database and nothing else from the read matches. That is simply a freak accident (or an occurrence with a certain probability) and does not count for anything. The biology is of course that (part of) a read must align to (part of) a resistance gene, however alignment is an other project. We are dealing with k-mers here.
You are not required to make certain that these freak accidents interfere with your computation, but ... maybe you could consider it as part of your method to handle it in some (maybe partial) way. Remember, NGS is inherently unreliable, and building something big and certain on top of unreliable data is an exercise in futility.
Optimization
Before starting to code, you should consider your method. NGS files are large and any analysis done on them will take time. You must realize that the resistance genes are a very small subset of the DNA represented in a NGS sample. The wall clock running time for a well-considered program is about 5 minutes for the samples used in this project and I have seen students just using half of that. I have solved it in 33 seconds on my i7-8700 CPU running at 3.20GHz. If your program takes 1 hour or more - go back to the thinking box. It is a great idea to test your program with a small excerpt from the FASTQ sample.
Input and output
The program must as input take a fasta file with resistance genes and a number of FASTQ files.
The FASTQ files are gzipped and the program must deal with that using the python gzip library.
FASTQ: Sample 1 and Sample 2
The FASTQ files are paired-end reads, this can be ignored and they can be considered to be one big sample. If you want to make something out of them being paired end reads, you are welcome.
The FASTQ files consist of reads like these:
@ILLUMINA-3BDE4F_0027:2:1:9216:1663#GCCAAT/1
CAGCCCGCCGATGGCTCCCACAAGNTGTATCTCTGTACAGGTGTTATCGGGAGAATACTTGATTGCATTGGAAAGCAGGTTACTGAAAGCACGTCGGAGCA
+ILLUMINA-3BDE4F_0027:2:1:9216:1663#GCCAAT/1
ZSGDVEMEQHNGGEGGSGJESSWVBO_]_]\DYV\\`SZ_aXaa`ccccccacc[Wcccaaccccacc[cca_cacc_cccaWccc[cccacc[ccb[ca_
@ILLUMINA-3BDE4F_0027:2:1:10636:1724#GCCAAT/1
TGCACAGGTAGCCCCTACGCCGCGNATGAACGACCGGAAACGCCGTCACATGATGGCGAAACCAGCCGACAAACTCCGCTTCCAGCCGCTTCAACACCGCC
+ILLUMINA-3BDE4F_0027:2:1:10636:1724#GCCAAT/1
a^DG_DPGGDQDFFFFQFKD\\Y\Bab]ac[NY[acaXa]cc_ccYccccccbccYcccaccac^acbWccccc_cHabb_aaa[[_Y__a^^Iaab[RY_
Every line which is not sequence can be ignored, and the sequence line is between the line starting with @ and the line starting with +.
The output is the gene names with their resistances, the coverage and the depth of the gene in the samples. Genes which have less than 95% coverage and/or a depth of less than 10 should not be shown. The genes must be sorted after coverage and depth, so the "certain" hits comes first.
For those genes which seem to be present in the NGS sample, it could be a good idea to make a plot of the depth for each position of the gene. It reveals pretty clearly if the gene is there or not.


Optional: Since some genes are just a few SNP's apart, then a "winner takes all" strategy could be implemented. There is no need to show a gene with less then 100% coverage or small depth, if the homolog has full coverage and good depth, because it means that the homolog is present in the sample and not the other.
References
These genes are in the data - it is a misunderstanding if you think the project is easier because you have the result:
aac(6')Ib-cr_1_DQ303918
strA_4_AF321551
strB_1_M96392
aac(3)-IIa_1_CP023555.1
blaCTX-M-15_23_DQ302097
blaOXA-1_1_J02967
blaSHV-28_1_HM751101
blaTEM-1B_1_JF910132
fosA_3_ACWO01000079
catB4_1_EU935739
oqxA_1_EU370913
oqxB_1_EU370913
sul2_2_GQ421466
tet(A)_4_AJ517790
dfrA14_1_DQ388123