Protein Structure and Visualization
By Anne Mølgaard and Thomas Holberg Blicher with some updates/editing by Rasmus Wernersson and Carolina Barra
Overview
In this exercise you will learn how to
- Search the Protein Structure Databank for information.
- Critically choose the best structure, when more than one is available.
- Visualize a protein structure and highlight features of interest.
You will work with the protein Rhamnogalacturonan acetylesterase (RGAE) from the fungus Aspergillus aculeatus. It is one of several enzymes used by the fungus to degrade the plant cell wall when “attacking” a plant.
Getting started
First, we will find some background information about the sequence of the protein. Go to UniProt: http://www.uniprot.org/ .
⇒ Enter the name of the protein: rhamnogalacturonan acetylesterase in the search field and click Go. You should find several matches.
⇒ Click on the Swiss-Prot entry (RHA1_ASPAC). If you scroll down you can learn a few things about the protein. Write down the following information:
Q1A
- The signal peptide is from residue number ____ to ____.
- The mature protein is from residue number ____ to ____, which means that the protein is ____ residues long.
- The active site is made up of three residues. The first is Ser26, the two others are _______ and _______.
- The protein is post-translationally modified, having two sites of N-glycosylation at ______ and ______.
If you scroll down further to the Structure section, you will have an overview of the existing crystal structures in the PDB and you will also find a predicted structure from AlphaFold.
Note the positions covered by the X-ray protein structures and the predicted protein structure from AlphaFold.
Q1B
- X-ray protein structures are from residue number ____ to ____.
- AlphaFold protein structures is from residue number ____ to ____.
Now we want more information on the protein structure than the given in Uniprot, so we need to go directly to the Protein Data Bank (PDB):
⇒ Go to the PDB homepage at http://www.rcsb.org.

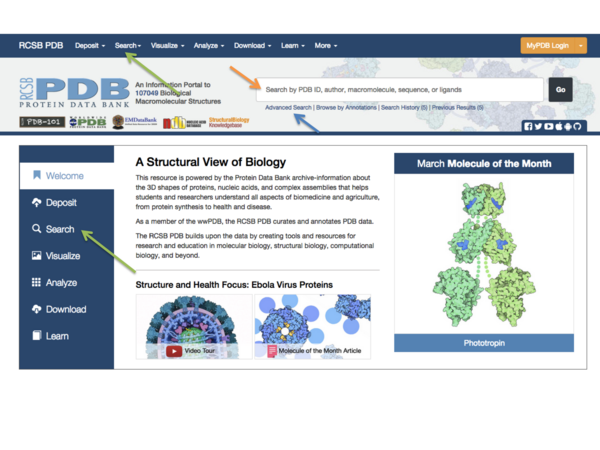
You can search the PDB immediately from the front page using a keyword or a PDB ID in the search field (orange arrow in Fig.1), or you can do a more advanced search using the buttons next to the search field (green arrow in Fig. 1). Other advanced options are found if you click the “Advanced” button next to the search field (blue arrow in Fig. 1). One very useful feature here is the ability to search for structures using a search sequence. Here we will just do a simple keyword search:
⇒ Type "rhamnogalacturonan acetylesterase" (remember the quote marks) in the search field and press enter (or the magnifying glass icon to the right). Inspect your results.
Q2
Are all hits relevant if you are looking for a representative structure of the sequence shown in the UniProt entry? What would make you skip some of the structures?
You should find more than one structure, which represents RGAE. You only need one, so you will have to decide which one is the best to use. To create a table showing the parameters you wish to compare for selected structures, select “Custom Report” from the drop-down menu labeled “-- Tabular Report --”. You now get a very long list of possible parameters to include in a report. You should only choose the relevant ones, or your resulting table will be very large. Select the following:
- Ligand name
- Resolution
- R-free
Click “Run Report”. Notice that if a PDB entry has more than one ligand, there will be one line for each ligand in the resulting table.
Q3 Choose the best structure that has sulfate ions bound. Which one did you choose? Why?
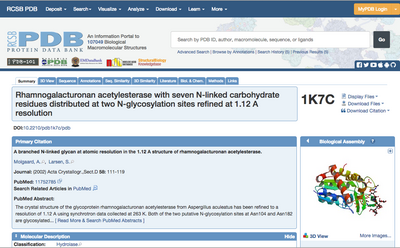
Click on the PDB ID of the structure you chose. This will take you to the page showing this entry in the Data Bank (Fig. 2). Have a look around to see which type of information is stored here.
⇒ If you click the “Display Files” drop-down menu (top right in Fig. 2) and select “PDB File”, you can see the actual contents of the PDB file. Try this.
A PDB file is a text file and its primary content is the 3-D coordinates (x,y,z) of each atom in the protein structure. However, the first many lines are so-called header lines and contain various pieces of information about the structure. Most of them begin with REMARK ###, with ### being a number describing the precise contents of the line. Below the header section you can find the coordinates of the structure. These coordinates are found in the second half of the PDB file where the lines that start with “ATOM” (or “HETATM” for non-protein atoms).
ATOM      5  N   SER A   2       8.646  26.448  43.030  1.00 20.04           N
ATOM      6  CA  SER A   2       8.423  27.866  43.346  1.00 18.87           C
ATOM      7  C   SER A   2       8.751  28.799  42.203  1.00 14.45           C
ATOM      8  O   SER A   2       9.551  28.450  41.307  1.00 16.65           O
ATOM      9  CB  SER A   2       9.219  28.236  44.584  1.00 27.30           C
ATOM     10  OG  SER A   2       8.715  27.379  45.647  1.00 29.28           O
The ATOM records (lines) present the atomic coordinates for standard residues, i.e. the protein part of the PDB file. They also present the occupancy and temperature factor for each atom. Heterogen coordinates use the HETATM record type and are used for everything else: organic compounds, buffer components, water molecules etc. The element symbol is always present to the far right on each ATOM/HETATM record; segment identifier and charge are optional. The coordinate section is always sorted such that the protein part(s) comes first (ATOM), followed by various small molecule ligands (HETATM) and then water molecules (HETATM). You can find a comprehensive description of the PDB format on the PDB homepage.
Knowing the x,y,z coordinates of all the atoms in the structure, the model can be viewed with a structure visualization program. We will use the program PyMOL in a little while to do this. Notice that the 1K7C structure has an extra line for every atom that starts with “ANISOU”. Such lines describe an anisotropic (non-uniform) vibration of the atoms and are only found in high-resolution structures (usually better than ca. 1.5 Å).

Q4 What is the residue name (three-letter abbreviation) for the sulfate ions? ________________ (You will need this to answer the following questions! Hint: Although the information can be found in the PDB file itself in the header as well as in the coordinates below the ATOM records (the residue name is a three-letter abbreviation found in the fourth column in each line), it is much easier to find it on the PDB webpage corresponding to your structure.)
Visualization & PyMOL
You can visualize the structure directly at the PDB website using a browser-based viewer (buttons are found below the structure image), but we will use the viewer PyMOL for our purposes. It is an excellent viewer that can also be used to prepare publication-quality images of protein structures, and it is a very valuable tool when working with protein structures.
⇒ If you have not already, download PyMol from the web site and install it on your computer.
The program has three panels: The Viewer panel where the molecule will be displayed, a right side panel with a list of all your objects, use the pull-down menus to show (S) or hide (H) elements, and the bottom panel where you can type commands in the command line.
⇒ If you type:
fetch 1k7c
at the command line in the GUI, PyMOL will fetch the structure for you from the PDB and display it in the Viewer. Try this. The molecule will now be shown in the Viewer and an object named “1K7C” has been created in the list to the right in the Viewer. You can toggle the object on and off by clicking on its name. Try this. To the right of the object name, there are five buttons: A(ction), S(how), H(ide), L(abel) and C(olor).
Troubleshooting: Occasionally, the fetch command may fail for certain installations of PyMOL, especially under Windows. In this case, go directly to the PDB homepage for the structure of interest and download the PDB file (as text) from the top right drop-down menu. Go to File - Open… in PyMOL and find the PDB file you just downloaded.
Q5
Click on H(ide) and select “waters”. What happened? (To undo this action, simply select S(how) – nonbonded.)
The molecule is by default shown in a “cartoon”, showing the secondary structure. Try to switch to the “lines” representation, click on S(how) – As – lines. This shows all the atoms and how they are connected through covalent bonds. You can try turning the molecule around using the mouse to view it from different angles. If you are interested in seeing the trace of the polypeptide string in order to get an idea of the fold of the protein (the tertiary structure), it is better to view the molecule in a simpler representation, where not all the atoms are shown. Try showing the molecule in a cartoon representation again: S(how) – As – Cartoon. Color the molecule by secondary structure: C(olor) – by ss – (choose a color scheme). This makes it easy to see the fold.
As you saw earlier, there are several sulfate ions in this structure. In order to view them, create an object containing the sulfates by entering the following command at the GUI command line:
create sulfate, resn XXX
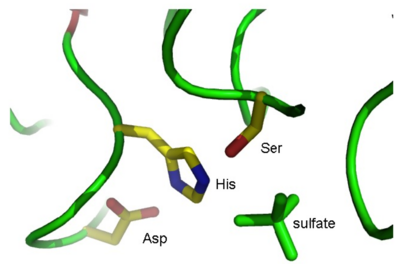
where XXX is the residue name of the sulfate ions (you found this earlier when you looked at the PDB file). This creates a new object named “sulfate” in your object list. Show the sulfates in “stick” representation: S(how) – As – sticks. As shown in Fig. 3, one of these sulfates is situated near the active site.

By looking at the sulfate ions in your Viewer window, try to find the active site in the molecule, and identify the three active site residues. (Hint 1: View the 1K7C object in ribbon representation and show amino acid side chains as lines colored by element. Hint 2: It gets easier if you create objects of the Ser, His, and Asp residues in the same way as you did for the sulfates and show these as sticks). If you click on a residue in the viewer window with the left mouse button, the program will tell you in the GUI window the name of the selected residue:
You clicked /1K7C//A/THR`10/CA
In the example above, the selected residue is threonine (Thr) 10 in chain A in molecule 1K7C.
Q6 The active site residues are: Ser_____, His_____ and Asp_____.
Does this correspond to the information you wrote down earlier from the UniProt entry? Why/why not?
Alternative approach: If directly looking at the amino acid side chains is not your strongest side, you can try the following approach instead:
- Go to back to the UniProt page (where you also picked up the information about the active site)
- Find the actual amino acid sequence of the protein, and notice the amino acids directly BEFORE and AFTER each active site residue (e.g. 5 amino acids to each side)
- Turn on sequence viewer mode in PyMol, and use the knowledge of the sequence AROUND the active site residue to help guide your selection.
Structure comparisons
Proteins exhibiting the same fold may occasionally have similar function, especially in the case of enzymes. However, when the proteins have reached the same fold by convergent evolution (or diverged a very long time ago), such similarities are not always obvious from sequence comparisons alone. Here, we will compare RGAE with platelet-activating factor acetylhydrolase (PAFA) from domestic cow (Bos taurus) and have a look at their active sites. These two enzymes have similar hydrolytic functions and catalytic residues but have no obvious sequence similarity (advanced alignment tools will identify approximately 20% identical residues).
⇒ First, fetch the structure for PAFA called 1WAB and open it in PyMOL along with the structure of RGAE. You will notice that the two structures are not aligned. To fix this, type the following:
align 1WAB, 1K7C
This will align the structure of PAFA (1WAB) with that of RGAE by moving the former. Navigate to the active site of RGAE found previously and identify the residues in PAFA corresponding to the active site residues in RGAE.
Q7 The active site residues of PAFA are: Ser_____, His_____ and Asp_____. Does this correspond to the residue numbering in RGAE? Why/why not?
Hint:
- if you color the active site amino acids in RGAE (1K7C) to something that is easy to recognize, it will be much easier to spot the overlap.
- Sequence viewer mode will also be a big help here - when you click a AA side chain in the other structure, the corresponding position will light up in the sequence view.
PyMOL links
- PyMOL home: http://www.pymol.org
- PyMOL manual: http://pymol.sourceforge.net/newman/userman.pdf
- PyMOL Wiki: http://www.pymolwiki.org/index.php/Main_Page
- PyMOL settings (documented): http://pymolwiki.org/index.php/Settings