Protein Structure: Difference between revisions
| (31 intermediate revisions by the same user not shown) | |||
| Line 2: | Line 2: | ||
== Overview == | == Overview == | ||
In this exercise you will learn how to | In this exercise you will learn how to | ||
* Search diferent protein databases to obtain protein structures. | * Search diferent protein databases to obtain protein structures. | ||
| Line 8: | Line 9: | ||
* Highlight features of interest and perform a basic alignment. | * Highlight features of interest and perform a basic alignment. | ||
This exercise is written a bit different. Instead of the step wise exercise we are going to try a different method called inquiry-based learning, where students explore real-world problems and questions, taking ownership of their learning by asking questions, conducting research, and developing their own solutions and understandings. | This exercise is written a bit different. Instead of the step wise exercise we are going to try a different method called inquiry-based learning, where students explore real-world problems and questions, taking ownership of their learning by asking questions, conducting research, and developing their own solutions and understandings. | ||
Therefore today we are going to start with a biological question we want to answer: | |||
'''Why only plant profilins are giving an allergic response despite their high conservation across species? Why are we not allergic to mammal profilins, for example?''' | |||
== A bit of background == | == A bit of background == | ||
| Line 24: | Line 29: | ||
Despite their ubiquity and structural conservation, humans typically only become allergic to plant profilins (e.g., from birch pollen, grass pollen, the rubber tree, or certain fruits/vegetables). | Despite their ubiquity and structural conservation, humans typically only become allergic to plant profilins (e.g., from birch pollen, grass pollen, the rubber tree, or certain fruits/vegetables). | ||
Today we would seek to understand: | ⇒ Today we would seek to understand: Why only plant profilins are giving an allergenic response despite their high conservation across species? | ||
''' | [[Image:Allergen-response.jpg|thumb|center|border|300px|'''Figure 1.''' The allergen response.]] | ||
== Getting started == | == Getting started == | ||
| Line 32: | Line 37: | ||
We know that protein functions are closely correlated to their 3D structure, so in order to understand what is different in Profilin proteins from plants and mammals we are going to gather some experimentally determined protein structures from plant and mammal proteins. | We know that protein functions are closely correlated to their 3D structure, so in order to understand what is different in Profilin proteins from plants and mammals we are going to gather some experimentally determined protein structures from plant and mammal proteins. | ||
First go to https://www.rcsb.org/ | ⇒ First go to the Protein Data Bank (PDB) https://www.rcsb.org/ | ||
[[Image:PDB.png|thumb|center|border|400px|'''Figure 2.''' The Protein Data Bank.]] | |||
We are looking for and antibody of the class E (those are related to allergy) in complex with a plant allergen (in this case we will use Hevea brasiliensis, the rubber tree). | We are looking for and antibody of the class E (those are related to allergy) in complex with a plant allergen (in this case we will use Hevea brasiliensis, the rubber tree). | ||
And search for ''IgE'' AND ''Hev b 8'' | ⇒ And search for ''IgE'' AND ''Hev b 8'' | ||
We are looking for a protein structure complex, so dismiss all the search results that do not contain a protein complex including both the '''IgE''' AND '''Hev b 8'''. | |||
'''Question 1.''' Look at the method X-RAY diffraction (Å). Which of the complexes is of better quality and why? | |||
== Visualization & PyMOL == | |||
You can visualize the structure directly at the PDB website using a browser-based viewer (buttons are found below the structure image), but we will use the viewer PyMOL for our purposes. It is an excellent viewer that can also be used to prepare publication-quality images of protein structures, and it is a very valuable tool when working with protein structures. | |||
⇒ If you have not already, download PyMol from the web site and install it on your computer. | |||
The program has three panels: | |||
* The "viewer panel" where the molecule will be displayed | |||
* The "objects panel" on the right, with a list of all your objects and with the pull-down menus to show (S) or hide (H) elements | |||
* The "command-line panel" in the bottom, where you can type commands | |||
[[Image:PyMOL_panels.png|thumb|center|border|400px|'''Figure 3.''' The PyMOL Panels.]] | |||
'''Important Note: In this exercise, you will do some command line coding and get some outputs on the PyMOL. Please remember to add your code into the answer along with the screenshot.''' | |||
⇒ | ⇒ Now select the best complex and load it into PyMOL using the ''fetch'' command. | ||
(If you cannot solve question 1 use this alternate code to continue the exercise: ''fetch'' 7SBG) | |||
You can toggle the object on and off by clicking on its name. Try this. To the right of the object name, there are five buttons: A(ction), S(how), H(ide), L(abel) and C(olor). | |||
⇒ Remove the water molecules and cofactors (''hetatm'') used for making the crystal using the command ''remove'' (these are not part of the of the protein complex). | |||
If you show the sequence, you will notice that each of the chains have a name H and L for the antibody (heavy and light chain) and C for the allergen. | |||
⇒ Colour the different chains of the antibody (IgE) in yellow and blue and the allergen (Hev b 8) in green. | |||
'''Hint: To colour chain A, you can do it on the command line by the command color -> color red, chain A.''' | |||
''' | |||
'''Question 2.''' Provide a screenshot of the complex. | |||
⇒ Let’s try to look at the surface of the interaction now. You can create an object called “antibody”, that contains both antibody chains (chain H+L) by the command select, and show as surface. | |||
'''Question 3.''' Provide a screenshot of the interaction surface. Which secondary structures of the allergen Is the antibody interacting with: alpha helices, beta-sheets or loops? | |||
⇒ Now we want to colour which specific residues of the allergen are in close contact with the antibody (exactly at a distance of 4Å). We will call this object the “epitope”. To define the distance, we can use the command ''around''. | |||
In order to select the full residues and not just the atoms of the allergen that are in direct contact we have to do a trick and select by residue using the command ''br.''. | |||
'''Hint:''' ''select'' ZZ, ''br''.(XX ''around'' 6) With this command we can select all residues in a distance of 6Å to XX, and name this new objext ZZ | |||
'''Question 4.''' Now colour the epitope in red and provide a screenshot. How many residues can you count that are in close contact with the IgE antibody? | |||
== Structure comparisons == | |||
Now that we have a clear idea of where the epitope of the allergen is, we would like to compare the allergen with another closely related profilin protein in mammals, for example in cow, to see what the differences are. | |||
'''Question 5.''' For that purpose, we will need to search for an homologous sequence to the one in our crystal structure, and guess which software we will use for that? | |||
Yes, you have guessed correctly! And to avoid you spending some time on the webserver we have performed such a search for you and found that the Uniprot ID for that one is Q2NKT1. | |||
⇒ Go to the Uniprot site and check on the available structures. | |||
You will notice that there are no experimental structures determined for this cow Profilin, however there are some predictions and models. | |||
'''Question 6.''' Can you explain what is the main difference of the crystal structures, the predicted structure and the modelled structure with SWISS-MODEL? Which one do you think would be more reliable? Here you are encouraged to use a chatbot to ask for hints, like chatGPT, but you will have to justify your selection. | |||
''' | |||
⇒ Pick one and download it. | |||
⇒ Now open the structure with PyMOL, in the same window where you have the previous complex. You can use the fetch command on the command line or go to File > Open.. and select the Profilin structure you have just downloaded. | |||
You will see that the new Profilin is in a random position in our screen. | |||
Under the "objects panel on the right you will see some quick buttons including "3-button Viewing, and magic wand, SEQ, and a camera to record videos. Make sure you have the SEQ button activated to show your sequence. | |||
[[Image: | [[Image:PyMOL_show_SEQ.png|thumb|center|border|400px|'''Figure 4.''' The PyMOL Structure of 9NUE. A subsection of Chain A is displayed in grey.]] | ||
⇒ Scroll where you can see the sequence name, which name has the new profilin in PyMOL? | |||
We will now try to align the sequences, to see where they are different and maybe explain why the cow profilin is not giving allergy. | |||
To align the two chains, we can use the command ''align''. The align command requires two elements to align separated by comma. | |||
'''Question 7.''' Provide a screenshot of the alignment. Can you see the differences of the two Profilins? | |||
''' | '''Question 8.''' Provide an hypothesis of why the cow profilin does not cross-react with the IgE antibody giving allergy to Hev b8. | ||
<!-- | <!-- | ||
== Making pretty pictures (an example) – NOT mandatory == | == Making pretty pictures (an example) – NOT mandatory == | ||
'''<span style="color:#FF0000">Q7</span>''' | |||
[[Image:1K7C_active_site_ray0.png|thumb|center|border|400px|'''Figure 4.''' Active site of RGAE, ray_trace_mode 0 (default).]] | [[Image:1K7C_active_site_ray0.png|thumb|center|border|400px|'''Figure 4.''' Active site of RGAE, ray_trace_mode 0 (default).]] | ||
| Line 198: | Line 157: | ||
--> | --> | ||
==PyMOL links== | ==PyMOL useful links== | ||
* PyMOL home: http://www.pymol.org | * PyMOL home: http://www.pymol.org | ||
* A cool PyMOL user guide: https://www.compchems.com/pymol-selection-tool/ | |||
* PyMOL manual: http://pymol.sourceforge.net/newman/userman.pdf | * PyMOL manual: http://pymol.sourceforge.net/newman/userman.pdf | ||
* PyMOL Wiki: http://www.pymolwiki.org/index.php/Main_Page | * PyMOL Wiki: http://www.pymolwiki.org/index.php/Main_Page | ||
* PyMOL settings (documented): http://pymolwiki.org/index.php/Settings | * PyMOL settings (documented): http://pymolwiki.org/index.php/Settings | ||
<!-- * [[Protein Structure and Visualization exercise answers]] --> | <!-- * [[Protein Structure and Visualization exercise answers]] --> | ||
Latest revision as of 09:33, 7 October 2025
By Carolina Barra Quaglia
Overview
In this exercise you will learn how to
- Search diferent protein databases to obtain protein structures.
- Critically choose the best structure, when more than one is available.
- Visualize a protein structure using PyMOL
- Highlight features of interest and perform a basic alignment.
This exercise is written a bit different. Instead of the step wise exercise we are going to try a different method called inquiry-based learning, where students explore real-world problems and questions, taking ownership of their learning by asking questions, conducting research, and developing their own solutions and understandings.
Therefore today we are going to start with a biological question we want to answer:
Why only plant profilins are giving an allergic response despite their high conservation across species? Why are we not allergic to mammal profilins, for example?
A bit of background
The question of today’s exercise is about allergens.
Allergens are fascinating because they aren’t random proteins; they cluster into certain protein families that repeatedly trigger allergic sensitization in humans.
However, one very interesting allergen protein family is the profilins. Here’s why:
They are highly conserved across species.
Profilins are small actin-binding proteins found in almost all eukaryotic cells (plants, animals, fungi).
Despite their ubiquity and structural conservation, humans typically only become allergic to plant profilins (e.g., from birch pollen, grass pollen, the rubber tree, or certain fruits/vegetables).
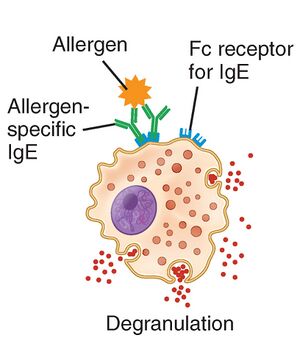
⇒ Today we would seek to understand: Why only plant profilins are giving an allergenic response despite their high conservation across species?

Getting started
We know that protein functions are closely correlated to their 3D structure, so in order to understand what is different in Profilin proteins from plants and mammals we are going to gather some experimentally determined protein structures from plant and mammal proteins.
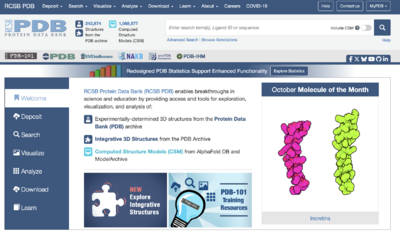
⇒ First go to the Protein Data Bank (PDB) https://www.rcsb.org/

We are looking for and antibody of the class E (those are related to allergy) in complex with a plant allergen (in this case we will use Hevea brasiliensis, the rubber tree).
⇒ And search for IgE AND Hev b 8
We are looking for a protein structure complex, so dismiss all the search results that do not contain a protein complex including both the IgE AND Hev b 8.
Question 1. Look at the method X-RAY diffraction (Å). Which of the complexes is of better quality and why?
Visualization & PyMOL
You can visualize the structure directly at the PDB website using a browser-based viewer (buttons are found below the structure image), but we will use the viewer PyMOL for our purposes. It is an excellent viewer that can also be used to prepare publication-quality images of protein structures, and it is a very valuable tool when working with protein structures.
⇒ If you have not already, download PyMol from the web site and install it on your computer.
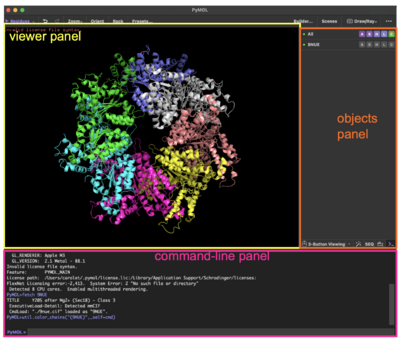
The program has three panels:
- The "viewer panel" where the molecule will be displayed
- The "objects panel" on the right, with a list of all your objects and with the pull-down menus to show (S) or hide (H) elements
- The "command-line panel" in the bottom, where you can type commands

Important Note: In this exercise, you will do some command line coding and get some outputs on the PyMOL. Please remember to add your code into the answer along with the screenshot.
⇒ Now select the best complex and load it into PyMOL using the fetch command.
(If you cannot solve question 1 use this alternate code to continue the exercise: fetch 7SBG)
You can toggle the object on and off by clicking on its name. Try this. To the right of the object name, there are five buttons: A(ction), S(how), H(ide), L(abel) and C(olor).
⇒ Remove the water molecules and cofactors (hetatm) used for making the crystal using the command remove (these are not part of the of the protein complex). If you show the sequence, you will notice that each of the chains have a name H and L for the antibody (heavy and light chain) and C for the allergen.
⇒ Colour the different chains of the antibody (IgE) in yellow and blue and the allergen (Hev b 8) in green.
Hint: To colour chain A, you can do it on the command line by the command color -> color red, chain A.
Question 2. Provide a screenshot of the complex.
⇒ Let’s try to look at the surface of the interaction now. You can create an object called “antibody”, that contains both antibody chains (chain H+L) by the command select, and show as surface.
Question 3. Provide a screenshot of the interaction surface. Which secondary structures of the allergen Is the antibody interacting with: alpha helices, beta-sheets or loops?
⇒ Now we want to colour which specific residues of the allergen are in close contact with the antibody (exactly at a distance of 4Å). We will call this object the “epitope”. To define the distance, we can use the command around.
In order to select the full residues and not just the atoms of the allergen that are in direct contact we have to do a trick and select by residue using the command br..
Hint: select ZZ, br.(XX around 6) With this command we can select all residues in a distance of 6Å to XX, and name this new objext ZZ
Question 4. Now colour the epitope in red and provide a screenshot. How many residues can you count that are in close contact with the IgE antibody?
Structure comparisons
Now that we have a clear idea of where the epitope of the allergen is, we would like to compare the allergen with another closely related profilin protein in mammals, for example in cow, to see what the differences are.
Question 5. For that purpose, we will need to search for an homologous sequence to the one in our crystal structure, and guess which software we will use for that?
Yes, you have guessed correctly! And to avoid you spending some time on the webserver we have performed such a search for you and found that the Uniprot ID for that one is Q2NKT1.
⇒ Go to the Uniprot site and check on the available structures.
You will notice that there are no experimental structures determined for this cow Profilin, however there are some predictions and models.
Question 6. Can you explain what is the main difference of the crystal structures, the predicted structure and the modelled structure with SWISS-MODEL? Which one do you think would be more reliable? Here you are encouraged to use a chatbot to ask for hints, like chatGPT, but you will have to justify your selection.
⇒ Pick one and download it.
⇒ Now open the structure with PyMOL, in the same window where you have the previous complex. You can use the fetch command on the command line or go to File > Open.. and select the Profilin structure you have just downloaded.
You will see that the new Profilin is in a random position in our screen.
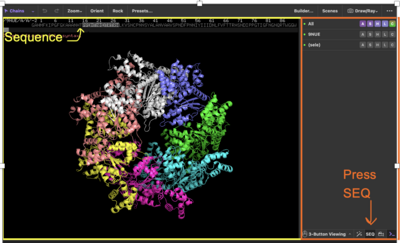
Under the "objects panel on the right you will see some quick buttons including "3-button Viewing, and magic wand, SEQ, and a camera to record videos. Make sure you have the SEQ button activated to show your sequence.

⇒ Scroll where you can see the sequence name, which name has the new profilin in PyMOL?
We will now try to align the sequences, to see where they are different and maybe explain why the cow profilin is not giving allergy.
To align the two chains, we can use the command align. The align command requires two elements to align separated by comma.
Question 7. Provide a screenshot of the alignment. Can you see the differences of the two Profilins?
Question 8. Provide an hypothesis of why the cow profilin does not cross-react with the IgE antibody giving allergy to Hev b8.
PyMOL useful links
- PyMOL home: http://www.pymol.org
- A cool PyMOL user guide: https://www.compchems.com/pymol-selection-tool/
- PyMOL manual: http://pymol.sourceforge.net/newman/userman.pdf
- PyMOL Wiki: http://www.pymolwiki.org/index.php/Main_Page
- PyMOL settings (documented): http://pymolwiki.org/index.php/Settings